
Unveiling the dynamics of Hungary’s innovation performance
Csaba DEAK  *
*
Baibhaw KUMAR *
Csaba DEBRECZENY *
Balazs DEAK *
Abstract. This article investigates Hungary’s growing status as a moderate innovator in the European Union, examining why it lags behind leaders like Denmark and emerging performers like Estonia. While previous research has focused on composite scores such as the European Innovation Scoreboard (EIS), this study combines these indicators with a Data Envelopment Analysis (DEA) approach to evaluate innovation efficiency. The study covers the period from 2016 to 2023 providing a temporal analysis of Hungary’s innovation deficit relative to the EU average, as well as a comparative assessment with chosen EU equivalents. The paper identifies systemic slackness in Hungary’s innovation ecosystem, notably in terms of converting R&D inputs and human capital into concrete innovation outputs.
Key words: European Innovation Scoreboard, Global Innovation Index, innovation performance.
1. Introduction
Innovation in a country is mostly about coming up with new ideas, making products and services, and getting them to the market effectively. This ability depends on a country’s research base, skilled workers, and technical infrastructure, all of which work together to make the economy more competitive and solve problems in society (Roukanas, 2021). In the late 20th century, people started trying to measure innovation on a national or regional level. In the beginning, researchers traditionally examined a few restricted indicators, such as how much money was spent on research and development (R&D) and how many patents were filed. D. B. Audretsch and Belitski (2020) have mentioned that R&D spending and patent counts were good initial steps in evaluating innovation, but they only showed a small part of the picture, mostly focusing on formal scientific and technological improvements. These measurements did not include social innovation, non-technological innovation or process-related gains that are common in many areas of the economy. This criticism made people realise that innovation is a complex thing that needs more comprehensive ways to be measured.
Single-dimensional measurements usually do not offer a complete picture, composite indices like the Global Innovation Index (GII) or the National Innovation Capacity Index (NICI) were created to give a more complete view. The Organisation for Economic Co-operation and Development (OECD) and Eurostat produced the Oslo Manual in the 1990s. It was built on the efforts of the OECD and Eurostat to create standardised ways to assess innovation that go beyond only patents and R&D spending (Ciaffi et al., 2024). These indices and recommendations include things like human capital, business sophistication, knowledge absorption capacity, and institutional frameworks. They provide a big picture view of innovation (Brás, 2023). For example, the NICI was designed to compare the innovation capacity of EU Member States by looking at both, how many new ideas they arrived at and how well they were able to use and apply them (Szopik-Depczyńska et al., 2020). More recent studies have even linked the circular material use rate to improvements in innovation-led industrial infrastructure. This shows that innovation indicators now cover environmental, industrial, and social aspects (Skare et al., 2024). Although they form the basis of innovation assessment, traditional measures such as R&D investment and sector classifications have limitations when it comes to capturing the entire range of innovative activities. The larger processes and behaviors that drive innovation inside organizations and industries are overlooked when we focus simply on the ‘object’ of innovation, such as patents or specific technology. In a similar argument, the OECD (2010) found that sector classifications based on research and development were often oversimplified; the boundaries between technology producers and users are becoming increasingly blurry in many industries, and firms often operate in both the manufacturing and service sectors, rendering static classifications less useful. Also, only looking at industries with a lot of or very little technology based on static R&D intensity levels does not consider how industries are always changing, especially those that work with digital platforms and services, where new ideas can come up outside of official R&D processes. We need measurement frameworks that are more complete and flexible since R&D measurements only give us useful baseline information and do not consider the variety, complexity, and process-oriented nature of modern innovation ecosystems.
However, even if measurement has gotten better, there is still a divide in the EU innovation landscape between the North and the South. Kowalski (2021) and Kowalski and Rybacki (2021) have both shown that countries in Northern and Western Europe are better at coming up with new ideas than countries in Southern and some Eastern Europe. This disparity is not just a result of differing levels of innovation; it is also due to structural problems in innovation ecosystems, such as the South’s inability to absorb new technology, weaker institutional frameworks, and poorer investment capacity. For instance, Denmark and Finland are great at making and selling high-end tech advances, but several Southern EU countries have a hard time using and adapting current technologies in a way that works. Over the years, these structural differences have grown. If strategic interventions do not focus on the capacity-building and absorption-side problems in regions that are falling behind, the gap in innovation potential across Europe is likely to remain the same. The starting knowledge resource and system-institution conditions determine the course of innovation development processes and their management. Therefore, it makes sense that areas with high levels of invention at the outset would develop more quickly than areas with lower levels of innovation capabilities (Kijek and Matras-Bolibok, 2018).
The National Innovation Efficiency Index and the National Innovation Strength Index are the two points of view from which this innovative method, called the National Information and Communication Infrastructure NICI, evaluates the effectiveness of a country’s capability for innovation. According to Cohen and Levinthal (1990), absorptive capacity explains why nations can use external information and modern technologies differently. Absorptive capacity is a country’s ability to perceive and use fresh foreign information productively in its economy. Investing in education, R&D, and institutional learning enhances this capacity. Knowledgeable human capital, technological infrastructure, and competent institutions help nations grasp and incorporate complicated foreign technologies. Strategic frameworks like the NICI in Africa show how nations align technological goals with socio-economic development to build (Information and Communication Technologies) ICT absorptive capacity. Countries may struggle to turn ICT policy into economic results without a base of human capital and prior experience with similar technology. Thus, absorptive capacity explains why some nations overtake others technologically despite similar access to global information flows. Compared to earlier indices, this dual approach offers a more thorough assessment of a nation’s capacity for innovation. Similar to global indices, the European Commission (EC) offers a comparative evaluation of the research and innovation performance of EU Member States, other European nations, and their neighbouring regions through the European Innovation Scoreboard (EIS) (European Commission, 2023b). It provides a descriptive assessment of EU countries by evaluating the relative merits and demerits of their national innovation systems and pinpointing issues that require attention.
The European Commission uses a composite measure called the Summary Innovation Index (SII) to create its annual innovation rankings through EIS. There is an average of 25 indicators that make the components of SII. Accordingly, it can be concluded that innovation performance is better the higher the average value of the 25 indicators. Given the limits of composite metrics like the Summary Innovation Index, innovation studies must critically evaluate measurement diversity. Edquist et al. (2018) have suggested that the SII, despite its popularity in EU policy circles, simply averages inputs, outputs, and contextual factors without separating them. This aggregate may oversimplify innovation system dynamics and produce deceptive rankings that do not reflect innovation performance. The authors called for efficiency or productivity-based measures that would link innovative outputs to inputs utilising index numbers and Data Envelopment Analysis. These methods show how well governments turn resources into innovation, improving system performance assessment. Such complex assessment methods help drive targeted innovation programs by showing how much governments invest in innovation and how effectively it produces returns. This discussion emphasizes the necessity for innovation measurement systems that account for national circumstances and innovative routes rather than composite scores. Similarly, the Global Innovation Index (GII) has employed a comparable efficiency approach. The ratio of the output sub-index score over the input sub-index score is known as the „Innovation Efficiency Ratio,” and it is supplied by the GII. There is a correlation between the competitiveness of the EU-28 nations and the measures of innovation and business sophistication, but there is only a modest correlation between their competitiveness and the sub-indices of the other two pillar groupings (basic necessities and efficiency enhancers) (Marčeta and Bojnec, 2020). It displays the amount of innovation output that a nation receives in relation to its inputs.
The EU wants to boost the innovative economy in every Member State because innovations are the main engine of sustainable economic growth and development, as well as a major factor in raising competitiveness and societal well-being (EU report, 2020). This means that in order to accomplish overall advancement, it is necessary to ensure their convergence and bridge the so-called innovation gap. This is based on the identification of key factors that contribute to the innovation gap (FIG) (Polyakov et al., 2023). This further enables each member state to strengthen its National Innovation System (NIS) by giving priority to the development of those indicators (e.g., FIG) that influence their standing within the EU the most. For those who value innovation, open innovation has a detrimental impact on the development of new products in medium and high-tech businesses. Open innovation has a stronger impact on process, organisational, and eco-innovation for moderate innovators (Leitão et al., 2024).The performance gaps throughout the Member States have shrunk between 2016 and 2023, notably within the categories of ‘Strong Innovators’ and ‘Moderate Innovators,’ according to the EC’s most recent report of 2023 for EIS. The bulk of moderate and emerging innovators reside in Southern and Eastern Europe, while Innovation Leaders and Strong Innovators are found in Northern and Western Europe. One of the primary factors that can cause nations to enter the middle-income trap is a lack of capacity for innovation (Lebdioui et al., 2021). The Hungarian pharmaceutical industry, the Czech automobile industry, and the recently established MNE-related university units and private universities are a few instances of how these businesses impact innovation systems in transition economies (Lengyel and Cadil, 2009). In addition to making investments in information and communication technology and intellectual property rights, Hungary and the other Visegrad nations should think about establishing extra-local connections in order to enhance and maintain territorial inventions (Amponsah Odei et al., 2024). In the context of the European Innovation Scoreboard’s 2023 report, which highlights the shrinking performance gaps among Member States, particularly between Strong Innovators and Moderate Innovators, Hungary stands out as a case warranting closer examination. As a Moderate Innovator with a performance at 70.4% of the EU average in the period of 2016-2023 as per GII, the country ranking fluctuated between 33 to 39 as highlighted in Fig. 1. Hungary’s position is both intriguing and indicative of the underlying challenges within its innovation ecosystem. This paper aims to dissect the factors contributing to Hungary’s performance gap in innovation, particularly its slower pace of improvement relative to the EU average and proposes a novel assessment framework that incorporates sustainability and renewable energy indicators into innovation measurement. The boundaries of open innovation vary throughout knowledge-intensive industries and across various geographic contexts; in national and international marketplaces, the creative industries face the most restrictions on knowledge exchange (B. D. Audretsch and Belitski, 2023).
This research work endeavors to rigorously analyze Hungary’s status as a moderate innovator within the European context by dissecting the contributory factors to its performance. The study is framed within a comparative temporal assessment from 2016 to 2022, keeping side by side Hungary’s innovation metrics against those of Estonia, the leading moderate innovator, and Denmark, recognised as the frontrunner in EU innovation. The purpose of this parallel is to elucidate the gaps and to identify actionable insights that could elevate Hungary’s innovation standing.
_popr_.png)
Source: EIS (European Commission, 2023).
_popr_.png)
Source: own work based on data from Dutta et al., 2023.
2. Methodology
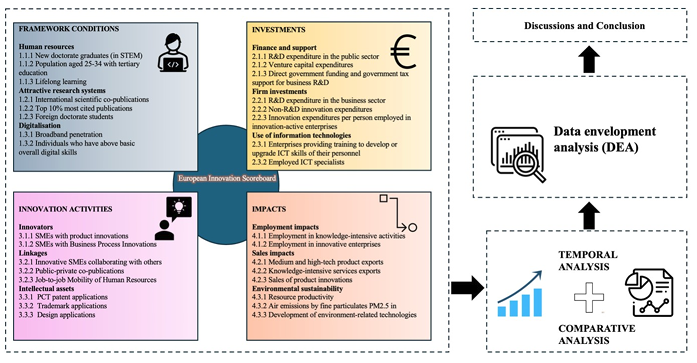
The methodology of our study is based on the analytical framework outlined by the European Innovation Scoreboard (EIS) 2023, which classifies innovation into four fundamental categories, i.e., Framework Conditions, Investments, Innovation Activities, and Impacts. A country’s innovation performance is depicted in a nuanced manner through the Summary Innovation Index (SII) (Katarina and Pavol, 2019), which is a collection of indicators that surround each of these categories. The study evaluates the fundamental components that support innovation, emphasizing lifelong learning, digital infrastructure, and human resources. These metrics assess the likelihood of innovation-driven growth by considering the amount and caliber of human capital in STEM disciplines, the popularity of postsecondary education, and the use of digital technology. Our analysis examines financial expenditures that support innovation, from both, public and private sectors. This includes venture capital and government funding directed towards R&D, critical drivers for innovative output Innovation has no appreciable effect on foreign direct investments (FDI) but has a beneficial influence on human resources, research, and creative outputs (Dempere et al., 2023). This dimension of innovation activities addresses the behaviors indicative of innovation within the economy, such as SMEs’ product and process innovations, collaborations, intellectual property creation, and job mobility among human resources (Bajkó et al., 2022). The vitality of these activities provides insight into the practical implementation of innovative ideas. Impacts are the tangible outcomes of innovation efforts that are reflected in this category. We analyse the direct effects on employment within knowledge-intensive sectors, the economic influence via sales impacts, and the broader societal contributions, including environmental sustainability metrics. To synthesize this data, we employed a two-analytical assessment approach as shown in the Fig. 2.
Temporal analysis: We conducted a longitudinal study spanning the period from 2016 to 2023 to identify trends, progress, and patterns in Hungary’s innovation journey. By examining the trajectory of these indicators, we can pinpoint areas of improvement and persistent challenges.
Comparative analysis: Our research contrasts Hungary’s current innovation performance with that of Estonia, the leading moderate innovator, and Denmark, an acknowledged innovation leader within the EU. This comparison not only benchmarks Hungary against its peers but also against the highest standard of innovation within the EU.
Data envelopment analysis (DEA): DEA is a non-parametric frontier analysis method, which benchmarks various decision-making units (DMUs) in this study to compare countries’ outputs from inputs. Our investigation used a BCC-based output-oriented DEA model with variable returns to scale (VRS) (Banker et al., 1984). The analysis ensures that the output orientation maximizes innovation outputs given its input capacity.
Source: own work.
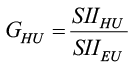
Furthermore, we introduce an innovative approach to quantifying the innovation gap of Hungary relative to the European Union average, utilising the Summary Innovation Index (SII). We aim to elucidate the discrepancy in innovation performance by comparing Hungary’s SII to that of the EU. This comparison serves as a barometer for assessing Hungary’s relative progress or regression in innovation. Equation (1) (Dworak, 2020), defines the innovation gap index for Hungary as the ratio of Hungary’s SII to the average SII for the EU in a year. This ratio provides a snapshot of Hungary’s innovation performance relative to the EU benchmark, enabling a direct comparison within the context of a specific year.
(1)
where,
GHU is the innovation gap index for Hungary in relation to the EU average in year t,
SIIHU is the Summary Innovation Index for Hungary in year t,
SIIEU is the average Summary Innovation Index for the EU in year t.
(2)
where,
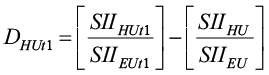
DHUt1 is the index of changes in the level of the innovation gap between Hungary and the EU average in a particular year t1 as compared to year t,
SIIEUt1 is the average Summary Innovation Index for the EU in year t1,
SIIHUt1 is the Summary Innovation Index for Hungary in year t1.
Equation (2) calculates the index of changes in the level of the innovation gap between Hungary and the EU average for a particular year t1 as compared to year t. Here, DHUt1 encapsulates the directional shift in Hungary’s innovation gap, with negative values signalling a widening of the gap, and positive values indicating its narrowing. It is imperative to understand that while DHUt1 indicates the direction of the gap’s movement, it does not quantify the absolute change in Hungary’s innovation performance.
The complexity lies in the interpretation of DHUt1. A negative DHUt1 could imply that Hungary’s innovation performance is declining relative to the EU average or that other EU countries are advancing at a faster pace. Conversely, a positive DHUt1 would suggest improvement in Hungary’s innovation activities or a deceleration in the EU’s average innovation growth. It is, therefore, crucial to contextualise the index of changes DHUt1 concerning the index of innovation gap GHU, to discern whether Hungary is closing the innovation gap by advancing its own performance or simply benefiting from a relative slowdown in the EU’s innovation growth.
The additional DEA was performed to assess innovation system efficiency in Hungary, Estonia, Denmark, and other EU nations to supplement our temporal and comparative research. Our historical gap analysis and Summary Innovation Index (SII) provide significant insights into absolute and relative innovation performance, but they do not show how well each country converts its innovation resources (inputs) into quantitative innovation outcomes. Therefore, the DEA assesses whether lower-performing countries like Hungary underperform owing to limited resources or inefficient use of existing capabilities. The choice of DEA inputs and outputs was guided by two considerations: (1) relevance to innovation ecosystem performance, and (2) alignment with available EIS indicators. After critical review, the following variables were selected:
Inputs:
- Public sector R&D expenditure (% of GDP) (capturing government innovation funding);
- Business sector R&D expenditure (% of GDP) (reflecting private sector innovation investment);
- Venture capital investment (% of GDP) (representing financial support for innovation startups);
- Human resources in science and technology (% of total employment) (as a proxy for skilled workforce);
- Broadband penetration (%) (capturing digital infrastructure that enables innovation activities).
Outputs:
- Patent applications per million population (innovation outcome in technological domains);
- Sales share of new-to-market products (%) (reflecting commercialisation of innovation);
- Employment in knowledge-intensive activities (% of total employment) (human capital utilisation);
- International scientific co-publications per million population (indicative of research collaboration and openness);
- Resource productivity (EUR/kg) (as a proxy for eco-innovation and efficiency).
The DEA efficiency score (q) for each country is calculated by solving the following linear programming model (output-oriented, VRS):
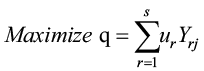
Subject to,
ur, vi and r, i
where,
Yrj = amount of r produced by country j
Xij = amount of i produced by country j
ur, vi = weights assigned to output r and input i
x = small positive number to avoid zero weights
Through gap calculation, our study meticulously dissects the multi-layered nature of innovation performance in Hungary. By adopting a holistic view that encompasses inputs, processes, and outputs of innovation, our approach provides a balanced and comprehensive understanding of Hungary’s innovation ecosystem. Our added comparison with Estonia and Denmark offers a lens to identify best practices and strategise on potential areas for enhancement to elevate Hungary from its current position as the least moderate innovator to a more competitive stance within the European Union.
3. RESULTS
3.1. Temporal analysis for Hungary
The temporal analysis provides a time-tested testament of the performance of a nation over a period. The graph depicted in Fig. 3 from the European Innovation Scoreboard presents a multifaceted view of Hungary’s innovation performance, offering both a comparative perspective against the EU average and a temporal analysis of performance changes over two intervals, 2016-2023 and 2022-2023.
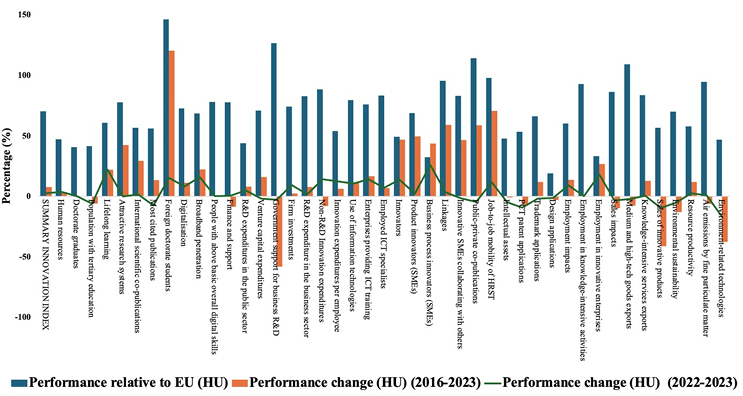
Source: own work based on the EIS scoreboard (European Commission, 2023).
The performance of Hungary, when assessed relative to the EU average, indicates a mixed innovation landscape. Hungary performs above the EU average in „International scientific co-publications” and „Sales impacts,” which suggests a commendable level of international research collaboration and an ability to translate innovations into marketable products with positive sales outcomes. Also, by contrast, in crucial sectors like „Venture capital expenditures” and „R&D expenditures in the business sector,” Hungary falls well short of the EU average, suggesting possible underinvestment in these vital innovation drivers.
Hungary has clearly seen significant oscillations in terms of the temporal shift in innovation performance from 2016 to 2023. A positive increase has been observed throughout the nation in „Innovative SMEs collaborating with others,” suggesting that the environment is becoming more favorable for small and medium-sized businesses to participate in cooperative innovation initiatives. A significant set down in „Design applications” and „R&D expenditures in the public sector,” for example, raises concerns about potential financing limits for research and development by the government and a potential loss in design innovation.
The performance change over the most recent period, 2022-2023, has revealed more about Hungary’s current innovation trajectory. The downward trends in „Non-R&D innovation expenditures” and „Renewable energy technologies,” albeit slight, may point to a short-term strategic de-prioritisation or fiscal realignment in these areas. Conversely, modest improvements in „Employment in knowledge-intensive activities” and „Resource productivity” hint at ongoing efforts to enhance the knowledge-based economy and efficient resource utilisation. From this EIS data, it is evident that Hungary has shown remarkable performance in several areas of innovation, such as marketable innovations and international co-publications; yet, there exist notable areas that necessitate attention in order to enhance the nation’s total potential for innovation.
3.2. Temporal analysis for Estonia
According to a study by Ferraro et al. (2023) over the 2014-2018 estimation period, Estonia’s Cohesion Policy funding for R&D and innovation had a positive short-term impact on employment and labour productivity. The impact was highest and most substantial for labour productivity. The graph in Fig. 4 presents delineates the innovation performance of Estonia (EE) against the backdrop of the European Innovation Scoreboard metrics. Estonia is recognised as the best-performing country within the „moderate innovator countries” category, and the analysis will focus on this distinction.
Estonia’s performance relative to the EU average indicates innovation prowess in specific areas. Notably, Estonia exceeds the EU average significantly in ‘Digitalisation’ and ‘Sales impacts,’ suggesting that the country has effectively harnessed digital technologies to boost its market presence and that these technologies have had a tangible impact on sales. Additionally, Estonia shows robust performance in ‘Human resources’ and ‘Attractive research systems,’ which implies a well-developed talent pool and a conducive environment for research and development.
Considering the timeframe from 2016 to 2023, Estonia’s innovation profile has seen substantial growth, particularly in ‘Job-to-job mobility’ and ‘Lifelong learning.’ These metrics suggest an agile and continuously improving workforce, key elements for sustaining innovation. There has also been notable advancement in ‘Broadband penetration,’ reflecting Estonia’s emphasis on high-speed internet as a foundation for digital innovation.
In the most recent term, i.e., 2022-2023, Estonia displayed a remarkable upward trajectory in ‘Non-R&D innovation expenditures,’ indicating an increased commitment to innovation beyond traditional research and development. This broad approach to innovation was essential for countries like Estonia that have aimed to carve out a niche in the competitive global market. However, it is important to recognise a decline in ‘Patent applications,’ which could signal a potential area for policy intervention to bolster intellectual property outputs.
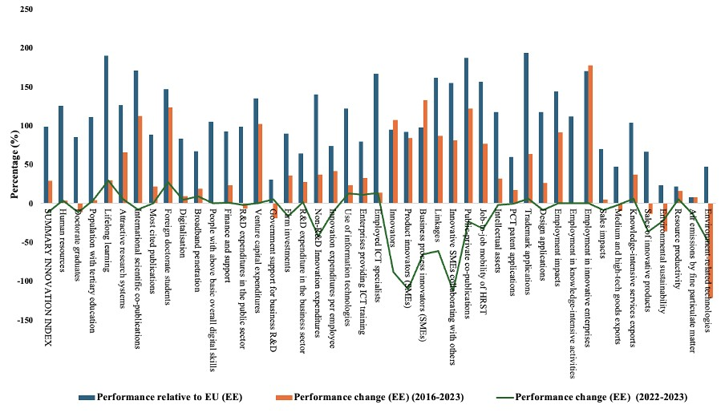
Source: own work based on the EIS score board (European Commission, 2023).
Estonia’s position as the best performer among the moderate innovators is underpinned by its strategic investments in digitalisation and human capital. The country’s substantial performance in ‘Sales impacts’ underscores the success of its innovation outputs in meeting market demands and driving economic growth. However, the decline in ‘Patent applications’ points to a potential vulnerability in maintaining a competitive edge in technological innovation. This calls for targeted strategies to stimulate intellectual property creation and to ensure that R&D investments translate into tangible outputs (Ciaffi et al., 2024). Moreover, Estonia’s commitment to ‘Non-R&D innovation expenditures’ suggests an acknowledgment of the diverse nature of innovation, extending beyond conventional R&D.
3.3. Comparative analysis with Denmark
As per the EIS 2023 report, Denmark, with a performance of 137.6% above the EU average, is a leader in innovation performance. Performance surpasses the Innovation Leaders’ mean. The rate of performance growth is more than the EU’s (8.5%-point) pace. The nation’s performance advantage over the EU is growing. In this section, we discuss a trendline assessment with the EU average, innovation leader, i.e., Denmark, and compare it with Hungary. The EUROSTAT database (European Commission, 2024a) was selected for its comprehensive and authoritative compilation of statistical information across the European Union, ensuring reliable and comparable data critical for assessing innovation performance trends. An analysis of these trend lines provides valuable insights into the development of human capital and innovation outputs within the region. By analysing the Eurostat data depicted in Fig. 5, we observed two distinct but interrelated trends regarding R&D expenditure and R&D personnel as percentages of GDP and the active population, respectively, across Denmark (DK), Estonia (EE), Hungary (HU), and the European Union (EU) averages.
.png)
.png)
Source: own work based on data from EUROSTAT (2023).
The graph a) illustrates the proportion of R&D personnel in the active population. Denmark consistently exceeds the EU average, indicating a strong commitment to cultivating a knowledge-intensive labor force, a key component of an innovative economy. Estonia, while starting from a lower baseline, shows an impressive and steady rise, suggesting robust policies in education and workforce development, which may drive its status as a top performer among moderate innovators. Hungary, however, displays a relatively flat trend with a slight uptick in recent years, signifying a potential area for policy intervention to expand its R&D workforce.
The graph b), the R&D expenditure as a percentage of GDP also presents noteworthy insights. Denmark showcases high and relatively stable investment levels, indicating a mature and sustained innovation policy. Estonia, mirroring its R&D workforce trend, displays notable expansion, indicating a rise in innovation investment as a key focus for the nation. Although Hungary’s trend fluctuates, it has consistently fallen behind the EU average, indicating the necessity for increased investment in research and development to bolster innovation.
Denmark’s significant investment in both sectors aligns with its position as a leader in innovation, indicating that continued investment in research and development is likely playing a role in strong innovation results and a vibrant, knowledge-based economy. Estonia’s developments, specifically in the number of R&D workers, show an increasing capacity for creativity, especially if the growth in R&D spending persists. Some reasons include developing geographically cross-border innovation clusters that have been established, such as the Öresund region between Denmark and Sweden. These clusters focus on specific tactics to enhance their competitiveness and foster continued development towards their goal of becoming a worldwide innovative cluster (Park, 2014). This may result in Estonia emerging as a key player in the EU innovation scene.
A country’s tendency for innovation can be deduced from its investment in R&D and size of its workforce. Denmark has made significant investments in both fields, aligning with its position as a pioneer in innovation. This indicates that continued funding in research and development probably aids strong results in innovation and a dynamic, knowledge-focused economy. Estonia is experiencing positive advancements, especially in the amount of R&D workers, indicating a rising possibility for innovation as long as R&D investment continues to increase. As a consequence of this, Estonia could emerge as a key player in the innovation sector of the EU.
Further, the graph a) of Fig. 6 displays the proportion of total employment that can be attributed to high-technology manufacturing and knowledge-intensive services. The EU’s positive trend indicates a move towards a knowledge-focused economy, with Denmark at the forefront due to its advanced workforce and focus on technology sectors. Estonia’s growth is showing potential, aligning with its growing recognition as a digital and technology-driven economy. Hungary is experiencing growth, but it is happening at a slower rate, pointing to a delayed uptake of knowledge-intensive tasks in its overall workforce.
The graph b) shows patent applications to the European Patent Office per million people, indicating significant variations in innovation levels. Denmark’s strong and consistent rate indicates a healthy climate for innovation and the development of intellectual property. Estonia’s increasing trend, while not as high as Denmark’s, indicates a growing ability for innovation and creating intellectual property. By contrast, Hungary’s lack of growth indicates a leveling off in innovation, as its patent application rates are much lower than the EU average, highlighting a potential need to enhance its innovation policy.
.png)
.png)
Source: own work based on data from EUROSTAT (2023).
Denmark’s results point to a developed ecosystem that fosters creativity and the creation of intellectual property. Estonia’s increasing trend shows how well its policies fostering innovation work and how much room it has for growth. In Hungary, the stagnation of patent applications points to a need for policy action, including improving the funding of research and development (R&D) endeavors, strengthening the linkages between academia and business, and offering financial incentives for the patenting and commercialisation of research findings. All of these tendencies point to the necessity of having the capacity to produce and apply high-tech knowledge in order to sustain a competitive advantage in the contemporary economy.
3.4. Summary Innovation Index analysis with the EU
In this section, the assessment of the comparative innovation gap between the Hungarian SII and the EU average SII over the recent years is presented. Table 1 illustrates a quantitative assessment of Hungary’s innovation performance relative to the EU average over the period 2016-2022, employing the Summary Innovation Index (SII) as a comparative metric. Through this period, the innovation gap index for Hungary GHU and the index of changes in the level of the innovation gap DHUt1 have been calculated to offer insights into Hungary’s trajectory in innovation development.
| Year | SIIHU | SIIEU | GHU | DHUt1 |
|---|---|---|---|---|
| 2016 | 100.000 | 68.568 | 0.68568 | 0 |
| 2017 | 100.448 | 68.482 | 0.6817657 | -0.0039143 |
| 2018 | 100.844 | 68.519 | 0.6794554 | -0.0062246 |
| 2019 | 102.983 | 66.924 | 0.6498548 | -0.0358252 |
| 2020 | 104.136 | 67.96 | 0.6526081 | -0.0330719 |
| 2021 | 106.296 | 70.419 | 0.6624802 | -0.0231998 |
| 2022 | 107.915 | 73.867 | 0.6844924 | -0.0011876 |
Source: own work based on data of European Innovation Scoreboard (EIS) 2023.
Based on the table, the GHU indicates Hungary’s SII as a proportion of the EU average SII, shedding light on Hungary’s relative standing. Initially, in 2016, Hungary’s SII stood at 68.568% of the EU’s average, signalling an innovation performance moderately below the EU benchmark. As we progressed through the years, there was a discernible downward trend in GHU, reaching a low of 0.6498 in 2019, before slightly improving to 0.6844 by 2022. This fluctuating trend reveals a varying pace of innovation growth in Hungary compared to the EU average, highlighting specific periods of both decline and relative recovery in Hungary’s innovation efforts.
The DHUt1 metric provides additional nuance by depicting the direction and volatility of the change in Hungary’s innovation gap compared to the reference year 2016. The negative values recorded annually from 2017 to 2021 suggest a widening innovation gap between Hungary and the EU. Notably, the year 2019 marked the most significant annual decrease, aligning with a substantial innovation gap. However, in 2022, the trend slightly reversed, as indicated by the less negative value, suggesting a modest closing of the innovation gap.
Moving to the comparison of Estonia’s performance as a ‘moderate innovator country’ offers important lessons that Hungary might apply to improve its own innovation strategy. The success of Estonia’s digital transition demonstrates the value of funding digital infrastructure and encouraging digital literacy for creativity. Furthermore, Hungary may enhance its innovation performance by investing in human capital through high-quality education and initiatives to retain talent. Estonia’s focus on non-R&D innovation investments highlights the importance of a diversified innovation strategy, which Hungary can adopt by broadening innovation funding and supporting small businesses and startups. The agile workforce and lifelong learning practices in Estonia suggest the need for Hungary to encourage job mobility and continuous education to keep up with emerging trends. Estonia’s decline in patent applications serves as a cautionary tale for Hungary, emphasising the importance of maintaining a balanced innovation portfolio and monitoring outcomes closely. By learning from both, Estonia’s successes and failures, Hungary can enhance its innovation capacity and performance in the future maybe through interdisciplinary pedagogy (Kumar and Deák, 2023). Adopting Estonia’s successful policies in digital transformation, human capital development, and broad-based innovation investments can help Hungary elevate its innovation ecosystem and contribute to overall innovation advancement in Europe and beyond.
3.5. Results of DEA analysis
The DEA comparison shows innovation efficiency discrepancies between Denmark, Estonia, and Hungary. Denmark has the highest proxy efficiency score because it effectively converts its strong R&D investments, robust venture capital market, and highly skilled workforce into innovation outputs like patent activity, knowledge-intensive employment, and international scientific collaboration. Despite its smaller economy and fewer inputs than Denmark, Estonia has a highly efficient innovation system. Its strategy focuses on digital infrastructure and human capital development helps it turn limited resources into substantial innovation, outperforming Hungary. Hungary’s efficiency score is the lowest of the three, showing underutilisation of innovation contributions. Hungary has invested in R&D capacity and digital infrastructure, but innovation outputs have not yet matched these investments, revealing structural inefficiencies and limitations in its innovation ecosystem’s commercialization and collaboration.
| Indicator | Denmark (2023) | Estonia (2023) | Hungary (2023) |
|---|---|---|---|
| Inputs | |||
| Public-sector R&D (% GDP) | 1.05 % | 0.76 % | 0.47 % |
| Business-sector R&D (% GDP) | 1.75 % | 0.98 % | 0.72 % |
| Venture-capital investment (% GDP) | 0.40 % | 0.15 % | 0.05 % |
| Human resources in S&T (% employment) | 25 % | 19 % | 14 % |
| Broadband penetration, households (%) | 97 % | 92 % | 82 % |
| Outputs | |||
| Patent apps. to EPO per million population | 145 | 72 | 45 |
| Sales share of new-to-market products (%) | 18 % | 11 % | 8 % |
| Employment in knowledge-intensive acts. (%) | 21 % | 16 % | 11 % |
| Int. scientific co-publications per million | 95 | 48 | 32 |
Source: own work based on DG ECFIN, 2023 Country Reports (EUROSTAT, 2024).
4. Discussion
It is essential to understand and evaluate the recent policy reforms designed to enhance national innovation performance for several reasons. Firstly, this enables countries to learn from each other’s approaches and adopt successful practices from various contexts. Regular evaluations enable nations to measure their progress against international benchmarks, establish achievable goals, and monitor advancements over time. Ongoing assessments also provide vital feedback, helping policymakers refine their strategies for optimal effectiveness. Additionally, these evaluations encourage international cooperation by showcasing successful methods that can be adapted and implemented across different countries, pooling resources and knowledge to address global issues like climate change and health emergencies.
These policies also generate jobs by encouraging the growth of new industries and business models, which in turn stimulate economic activity. Countries or subcontinents that excel in innovation improve their global competitiveness, attracting investments and high-value industries. Furthermore, innovation policies that prioritise sustainability support the development of green technologies, minimising environmental impact and ensuring long-term ecological stability.
Furthermore, Table 3 depicts the latest strategies that various European countries have implemented to improve their innovation capabilities for future benefits. In 2022, the New European Innovation Agenda was introduced by the European Union as a demonstration. This ambitious strategy aims to promote innovation across Europe by improving policy frameworks at various levels, supporting the growth of tech companies, and leveraging new technologies like Artificial Intelligence, machine learning, etc. Germany launched the High-Tech Strategy 2025 program in 2021 with the intention of increasing funding and promoting collaborations between the public and private sectors. The goal of this plan is to improve the innovative capacities of startups and small and medium-sized enterprises while assisting them in thriving in a competitive market. To increase competitiveness and promote environmental sustainability, France has put in place a novel investment plan that gives green technology and digital transformation first priority. In order to promote innovation, Finland’s RDI Roadmap 2025 initiative seeks to fortify partnerships between the public and private sectors as well as academic institutions. Italy’s National Recovery and Resilience Plan places a strong emphasis on digitalisation, innovation, and the transition to greener technologies, supported by considerable financial investments. Employing a variety of tactics in different nations demonstrates a dedication to encouraging innovation, enhancing economic expansion, and ensuring lasting sustainability. By contrast, the Netherlands have prioritised sustainability and digital transformation in important sectors with its Mission-driven top sectors and innovation policy. The goal of Sweden’s innovation partnership programs is to address societal issues through cooperation between the public, private, and academic sectors. Spain’s Entrepreneurial Nation Strategy encourages a mindset of entrepreneurship in the southwest region and offers financial incentives to creative small and medium-sized businesses.
These policies represent strategic responses to the evolving global innovation landscape, demonstrating how EU countries are leveraging their unique strengths to drive economic growth, create jobs, and enhance global competitiveness.
| Country Name | Policy Adopted | Year of Adoption | Remarks | Reference |
|---|---|---|---|---|
| European Union | New European Innovation Agenda | 2022 | Focuses on scaling up deep-tech start-ups, improving policy frameworks, and fostering innovation ecosystems. | (European Commission, 2022) |
| Germany | High-Tech Strategy 2025: Strengthening the innovation ecosystem through increased funding for startups. | 2021 | Aims to support start-ups and SMEs through enhanced funding mechanisms and partnerships. | (Wittmann et al., 2020) |
| France | France 2030: A 30 billion euro investment plan focusing on green technologies and digital transformation. | 2021 | Investments targeting ecological transition and digital innovations to boost competitiveness. | (France Diplomacy, 2024) |
| Finland | Research, Development, and Innovation (RDI) Roadmap 2025: Enhancing public-private collaboration. | 2022 | Encourages collaboration between academia, industry, and government to drive innovation. | (STIP Compass, 2024) |
| Italy | National Recovery and Resilience Plan: Focus on digitalisation, innovation, and green transition. | 2021 | Focuses on sustainable growth and digital transformation through significant investments. | (European Commission, 2024b) |
| Netherlands | Mission-Driven Top Sectors and Innovation Policy: Emphasising sustainability and digital transformation. | 2021 | Prioritizes sustainability and digital innovations in top sectors to drive economic growth. | (Larrue, 2021) |
| Sweden | Innovation Partnership Programmes: Collaboration between government, industry, and academia. | 2022 | Aims to address societal challenges through collaborative innovation efforts. | (ECCP, 2019) |
| Spain | Spain Entrepreneurial Nation Strategy: Supporting startups and innovative SMEs. | 2021 | Targets fostering an entrepreneurial culture and supporting innovative SMEs through various incentives. | (La Moncloa, 2021) |
Source: own work based on the references of the table.
5. Conclusion
This analysis offers a comprehensive, multi-dimensional assessment of Hungary’s innovation landscape by connecting empirical performance indicators with the latest European policy changes. Adding DEA to the EIS framework has revealed an interesting finding: Hungary’s innovation problems are not just related to insufficient investment, but also to inefficiencies in converting inputs into outputs. Despite large investments in R&D and digital infrastructure, Hungary trails behind its counterparts in patents, knowledge-intensive employment, and commercialisation. This trend is evident in both, historical data and the findings of the DEA analysis. Policies examined across the EU, such as Germany’s High-Tech Strategy, France’s emphasis on ecological innovation, and Finland’s RDI Roadmap, provide concrete examples of how targeted and coordinated changes can increase innovation efficiency. Although Hungary has implemented positive measures, such as competence centers and joint Ph.D. programs, these initiatives can be improved to systematically align with national interests.
The DEA results indicate that Estonia demonstrates superior innovation efficiency compared to Hungary, even with smaller R&D budgets. This advantage is attributed to its emphasis on digital governance, investments in non-R&D innovation, and flexible human capital strategies. In contrast, Denmark integrates ongoing investments with stable policies to maintain its position at the forefront of innovation. Hungary should focus on enhancing the internal coherence of its innovation system. This involves not only increasing funding but also addressing structural bottlenecks, strengthening inter-institutional connections, and ensuring that policy incentives are aligned with quantifiable innovation outcomes.
Moreover, this study illustrates that assessing policy reforms in the absence of a structured analytical framework may lead to oversimplification. Incorporating DEA into the analysis allows us to transcend mere descriptive performance evaluations and shift towards diagnostics focused on efficiency-driven innovation. This methodological advancement brings considerable value to policy discussions, providing a scalable framework for other moderately innovative nations aiming to enhance their innovation capacity in a resource limited context. Hungary’s future course must not only emulate the financial size of innovation leaders but also adopt a results-driven policy approach, ensuring that every euro invested returns corresponding societal and economic innovation advantages.
Autorzy
REFERENCES
AMPONSAH ODEI, S., LASISI, T. T. and KOLAWOLE ELUWOLE, K. (2024), ‘Determinants of territorial innovations in the macroregion of Visegrád countries: a seemingly unrelated probit analysis’, Review of Regional Research, 44 (1), pp. 73–118. https://doi.org/10.1007/s10037-024-00206-y
AUDRETSCH, B. D. and BELITSKI, M. (2023), ‘The limits to open innovation and its impact on innovation performance’, Technovation, 119, 102519. https://doi.org/https://doi.org/10.1016/j.technovation.2022.102519
AUDRETSCH, D. B. and BELITSKI, M. (2020), ‘The role of R&D and knowledge spillovers in innovation and productivity’, European Economic Review, 123. https://doi.org/10.1016/j.euroecorev.2020.103391
BAJKÓ, N., FÜLÖP, Z. and PÉRCSI, K. N. (2022), ‘Changes in the Innovation-and Marketing-Habits of Family SMEs in the Foodstuffs Industry, Caused by the Coronavirus Pandemic in Hungary’, Sustainability (Switzerland), 14 (5). https://doi.org/10.3390/su14052914
BANKER, R. D., CHARNES, A. and COOPER, W. W. (1984), ‘Some Models for Estimating Technical and Scale Inefficiencies in Data Envelopment Analysis’, Management Science, 30 (9). https://doi.org/10.1287/mnsc.30.9.1078
BRÁS, G. R. (2023), ‘Pillars of the Global Innovation Index by income level of economies: longitudinal data (2011-2022) for researchers’ use’, Data in Brief, 46, 108818. https://doi.org/10.1016/j.dib.2022.108818
CIAFFI, G., DELEIDI, M. and MAZZUCATO, M. (2024), ‘Measuring the macroeconomic responses to public investment in innovation: evidence from OECD countries’, Industrial and Corporate Change, 00, pp. 1–20. https://doi.org/10.1093/icc/dtae005/7591234
DEMPERE, J., QAMAR, M., ALLAM, H. and MALIK, S. (2023), ‘The Impact of Innovation on Economic Growth, Foreign Direct Investment, and Self-Employment: A Global Perspective’, Economies, 11 (7). https://doi.org/10.3390/economies11070182
DUTTA, S., LANVIN, B., LEON, L. and VINCENT, S. (2023), Global Innovation Index 2023, https://www.wipo.int/global_innovation_index/en/2023/ [accessed on: 04.03.2024].
DWORAK, E. (2020), ‘The innovation gap between the polish economy and the European union’, Comparative Economic Research, 23 (3), pp. 63–73. https://doi.org/10.18778/1508-2008.23.20
ECCP. (2019), Swedish innovation partnership programmes, https://www.clustercollaboration.eu/content/swedish-innovation-partnership-programmes [accessed on: 02.03.2024].
EU (2020), Updating the 2020 New Industrial Strategy: Building a stronger Single Market for Europe’s recovery, https://commission.europa.eu/document/9ab0244c-6ca3-4b11-bef9-422c7eb34f39_en [accessed on: 03.03.2024].
EUROPEAN COMMISSION (2022), A New European Innovation Agenda, https://eur-lex.europa.eu/legal-content/EN/TXT/?uri=CELEX%3A52022DC0332 [accessed on: 02.03.2024].
EUROPEAN COMMISSION (2023), European innovation scoreboard. https://doi.org/doi:10.2777/119961
EUROPEAN COMMISSION (2024a), EUROSTAT DATA, https://ec.europa.eu/eurostat/web/science-technology-innovation/database [accessed on: 04.05.2024].
EUROPEAN COMMISSION (2024b), Italy’s recovery and resilience plan.
EUROSTAT (2023), Dataset SDG GOAL-9 (Industry, Innovation and Infrastructure), https://ec.europa.eu/eurostat/databrowser/explore/all/tb_eu?lang=en&subtheme=sdg.sdg_09&display=list&sort=category&extractionId=sdg_09_40 [accessed on: 04.05.2024].
EUROSTAT (2024), European Innovation Scoreboard 2024 – Methodology Report & Dataset, https://research-and-innovation.ec.europa.eu/document/download/074d5495-433a-440f-bcf9-dc620fce7af1_en?filename=ec_rtd_eis-2024-methodology-report.pdf [accessed on: 05.05.2024].
FERRARO, S., MÄNNASOO, K. and TASANE, H. (2023), ‘How the EU Cohesion Policy targeted at R&D and innovation impacts the productivity, employment and exports of SMEs in Estonia’, Evaluation and Program Planning, 97, 102221. https://doi.org/10.1016/j.evalprogplan.2022.102221
FRANCE DIPLOMACY (2024), France Relance recovery plan: building the France of 2030.
KATARINA, J. and PAVOL, K. (2019), ‘An in-depth analysis of the summary innovation index in the V4 countries’, Journal of Competitiveness, 11 (2), pp. 68–83. https://doi.org/10.7441/joc.2019.02.05
KIJEK, T. and MATRAS-BOLIBOK, A. (2018), ‘INNOVATIVENESS OF EUROPEAN REGIONAL SPACE: CONVERGENCE OR DIVERGENCE?’, Acta Scientiarum Polonorum. Oeconomia, 17 (1), pp. 59–65. https://doi.org/10.22630/aspe.2018.17.1.7
KOWALSKI, A. M. (2021), ‘Dynamics and Factors of Innovation Gap Between the European Union and China’, Journal of the Knowledge Economy, 12 (4), 1966–1981. https://doi.org/10.1007/s13132-020-00699-1
KOWALSKI, A. M. and RYBACKI, J. (2021), ‘Moderate innovator trap-does the convergence of innovation performance occur in the world economy?’, Economies, 9 (1). https://doi.org/10.3390/economies9010011
KUMAR, B. and DEÁK, C. (2023), ‘Evolving Minds: A Literature-Driven and Empirical Exploration of STEAM Skill Development and Learning Approaches’, Journal of Innovation Management, 11 (4), pp. 71–96. https://doi.org/10.24840/2183-0606_011.004_0004
La MONCLOA (2021, February 11), Spain Entrepreneurial Nation Strategy, https://www.lamoncloa.gob.es/lang/en/temas/entrepreneurial-nation/Documents/ENE_Executive%20Summary.pdf [accessed on: 02.03.2024].
LARRUE, P. (2021), The design and implementation of mission-oriented innovation policies: A new systemic policy approach to address societal challenges. https://doi.org/10.1787/3f6c76a4-en
LEBDIOUI, A., LEE, K. and PIETROBELLI, C. (2021), ‘Local-foreign technology interface, resource-based development, and industrial policy: how Chile and Malaysia are escaping the middle-income trap’, The Journal of Technology Transfer, 46 (3), pp. 660–685. https://doi.org/10.1007/s10961-020-09808-3
LEITÃO, J., de BRITO, S. and PEREIRA, D. (2024),’Organizational ambidexterity, open innovation and innovation outputs: How do followers and low-flyer EU countries innovate?’, International Journal of Innovation Studies, 8 (2), pp. 186–235. https://doi.org/https://doi.org/10.1016/j.ijis.2024.01.001
LENGYEL, B. and CADIL, V. (2009), ‘Innovation Policy Challenges in Transition Countries: Foreign Business R&D in the Czech Republic and Hungary’, Transition Studies Review, 16 (1), pp. 174–188. https://doi.org/10.1007/s11300-009-0046-5
MARČETA, M. and BOJNEC, Š. (2020), ‘Drivers of Global Competitiveness in the European Union Countries in 2014 and 2017’, Organizacija, 53 (1), pp. 37–52. https://doi.org/10.2478/orga-2020-0003
PARK, S.-C. (2014), ‘Innovation policy and strategic value for building a cross-border cluster in Denmark and Sweden’, AI & SOCIETY, 29 (3), pp. 363–375. https://doi.org/10.1007/s00146-013-0460-4
POLYAKOV, M., KHANIN, I., SHEVCHENKO, G., BILOZUBENKO, V. and KORNEYEV, M. (2023), ‘Determining the Key Factors of the Innovation Gap between EU Countries’, Problems and Perspectives in Management, 21 (3), pp. 316–329. https://doi.org/10.21511/PPM.21(3).2023.25
ROUKANAS, S. (2021), ‘Measuring Innovation of Countries’, KnE Social Sciences, 5 (9), pp. 157–189. https://doi.org/10.18502/kss.v5i9.9892
SKARE, M., GAVUROVA, B. and RIGELSKY, M. (2024), ‘Quantification of the impact of innovations in industry and infrastructure for sustainable circular economy production and consumption’, Journal of Innovation & Knowledge, 9 (1), 100456.https://doi.org/10.1016/j.jik.2023.100456
STIP COMPASS (2024), Innovation in firms and innovative entrepreneurship in Finland, https://stip.oecd.org/stip/interactive-dashboards/countries/Finland/themes/TH3 [accessed on: 02.03.2024].
SZOPIK-DEPCZYŃSKA, K., CHEBA, K., BĄK, I., KĘDZIERSKA-SZCZEPANIAK, A., SZCZEPANIAK, K. and IOPPOLO, G. (2020), ‘Innovation level and local development of EU regions. A new assessment approach’, Land Use Policy, 99. https://doi.org/10.1016/j.landusepol.2020.104837
WITTMANN, F., ROTH, F., WITH, M. H., LINDNER, R., YORULMAZ, M., BRATAN, T., ARENS, M., ROHDE, C., OSTERTAG, K., PFAFF, M.-T., STAHLECKER, T., ZENKER, A. and STEINEBRUNNER, D. (2020), First Mission Analysis Report of the Scientific Support Action to the German Hightech Strategy 2025, https://www.isi.fraunhofer.de/content/dam/isi/dokumente/ccp/2020/Hightech%20Strategy%202025%20-%20first%20mission%20analysis%20report.pdf [accessed on: 04.04.2025].