
Evaluating changes in spatial configuration in Makassar: a space syntax approach
Andi Andre Pratama PUTRA  *
*
Abstract. As cities expand, their morphology and spatial configuration evolve, necessitating the integration of new spatial plans with existing ones to preserve urban identity. Understanding these changes is crucial for sustainable urban development and effective spatial planning. This study examines spatial transformations in Makassar, Indonesia, following the implementation of a new spatial plan. Using the space syntax method, specifically Angular Segment Analysis (ASA), key spatial properties – including integration, intelligibility, and accessibility – were assessed. ASA was employed to address the lack of geometric information by weighting segment lines according to their angular connections. The findings indicate that as the city grows, overall intelligibility and accessibility tend to decline. However, an increase in local intelligibility and accessibility suggests that well-planned urban design can mitigate these effects, enhancing spatial intelligibility and accessibility. These insights underscore the role of spatial configuration in shaping urban dynamics and highlight the need for a holistic planning approach to maintain integration, intelligibility, and accessibility.
Key words: spatial configuration, space syntax, morphology, integration, intelligibility, accessibility.
1. Introduction
Cities around the world are experiencing rapid expansion and land-use changes. By 2030, it is predicted that 60% of the global population will reside in urban areas, with Africa and Asia experiencing the most rapid urbanisation (Wang and Kintrea, 2021). Developing countries such as India are witnessing alarming urban expansion rates, leading to significant land-use transformations and environmental degradation (Ghosh, 2019). Similarly, Iran has faced uncontrolled urban sprawl, encroaching upon agricultural lands and green spaces (Parsipour et al., 2019). The spatial growth of cities influences multiple urban dynamics, including environmental sustainability, socio-economic development, and infrastructure planning (Lu et al., 2021). These challenges highlight the urgent need for holistic urban planning approaches that integrate social, environmental, and economic considerations to promote sustainable and well-coordinated development.
Understanding urban dynamics requires interdisciplinary approaches, integrating sociological theories, urban design, and spatial analysis. Recent studies emphasize the importance of pedestrian-oriented development, mixed-use centres, and inclusive urban policies to enhance livability (Kozhakhmetov and Abilov, 2022). Moreover, advancements in computer vision and artificial intelligence have facilitated new methods for analysing urban environments (Prell, 2022). However, despite these developments, research on spatial configuration and urban morphology in Southeast Asian cities remains limited, leaving a critical gap in understanding how urban spaces evolve in rapidly developing regions.
Urban space encompasses the physical environment of a city, including buildings, streets, squares, parks, and public areas where citizens interact and engage in various activities. It is a complex, evolving mechanism that significantly influences urban life by shaping social interactions, cultural exchange, and mobility patterns (Shymko, 2022; Viderman et al., 2022). Rather than being static, urban spaces transform over time due to changes in routines, spatial contestations, and planning decisions (Noor and Kamar, 2022). Thoughtful urban design and planning must consider the diverse needs of residents, ensuring accessibility, safety, and inclusivity to enhance urban livability (Petrova and Dvoinev, 2020).
A well-designed urban space contributes to the overall integrity of the city by fostering connectivity between its various elements, such as streets, neighbourhoods, and public squares. The street network, in particular, is a crucial component of urban morphology, serving as the backbone of a city’s spatial structure (Oktay, 2023). Studies on urban form and expansion have extensively examined street network configurations, analysing their orientation, connectivity, and entropy to uncover spatial logic and urban order (Boeing, 2019). The application of Geographic Information Systems (GIS) and Space Syntax methods has facilitated the analysis of traditional city centre morphologies, providing valuable insights into urban growth and transformation (El Gouj et al., 2022). Additionally, complex network theory has been employed to examine the relationship between street network structures and economic development, utilising indicators such as betweenness and closeness centrality to quantify urban spatial characteristics (Soltani et al., 2022a).
The Space Syntax method, developed by Hillier and colleagues, has emerged as a widely used technique for analysing urban morphology and spatial (Yamu et al., 2021). It enables the examination of spatial properties such as integration, connectivity, and visual exposure to better understand urban structures and their impact on human mobility (Soltani et al., 2022b). This method has been applied in various fields, including urban design, architectural research, and urban planning, to inform decision-making processes and improve city layouts. Studies utilising Space Syntax have revealed critical insights into socio-spatial experiences, children’s commuting patterns, and neighbourhood accessibility (LOBsang et al., 2019). Importantly, research findings suggest that as cities expand, their spatial intelligibility and accessibility tend to decline (Günaydin and Yücekaya, 2020).
Despite the growing significance of spatial analysis in urban studies, the application of Space Syntax – a widely used method for analysing urban morphology – has been predominantly concentrated in European and North American cities. In Southeast Asia, particularly Indonesia, research utilising Space Syntax to evaluate the long-term effects of historical spatial planning on urban development remains limited. This study aims to fill this gap by examining Makassar, one of Indonesia’s largest and fastest-growing cities, to analyse how past and present urban planning decisions have shaped its spatial configuration and influenced its future development.
Urban planning decisions – from neighbourhood-scale interventions to citywide development frameworks – play a crucial role in shaping a city’s long-term structure and functionality. Given the rapid urban transformation of Makassar, evaluating its historical and contemporary urban planning strategies is essential to ensuring an integrated and sustainable future urban form. This study investigates how spatial intelligibility and accessibility in Makassar have been influenced by historical and contemporary urban planning approaches. Furthermore, it assesses the role of Angular Segment Analysis (ASA) within the Space Syntax framework to examine spatial integration, intelligibility, and accessibility patterns.
By bridging the gap between historical urban planning and modern spatial development, this research aims to contribute to urban planning discourse by offering insights into how cities can integrate historical urban forms with contemporary planning strategies to ensure sustainable and coherent spatial growth.
2. Methods
The Space Syntax approach was applied using axial map analysis to evaluate spatial configurations in Makassar. The analysis was conducted with DepthmapX, a software developed by Turner, to measure the intelligibility and accessibility of the city’s spatial plans. The spatial datasets were obtained from the Makassar City Spatial Planning Department in GIS layer format and subsequently converted into DXF (Drawing Exchange Format) files for compatibility with DepthmapX.
Two datasets were used, representing the years 2023 and 2034. The 2023 map reflects the current urban layout, while the 2034 map represents the official future development plan. This timeframe was deliberately chosen to capture and compare the present spatial structure with the projected urban form upon completion of the Center Point of Indonesia (CPI) – a strategic national project expected to significantly influence urban growth and movement patterns in Makassar.
Through this analysis, the study identifies the advantages and limitations of the planned urban development and offers recommendations to mitigate potential negative impacts. The findings are intended to provide evidence-based input that can inform policy decisions and contribute to improving the effectiveness and sustainability of future city development plans.
2.1. Research case
This study is located in Makassar city, South Sulawesi Province, Indonesia, which, according to BAPPENAS, is one of the four major growth centres in Indonesia, along with Medan, Jakarta, and Surabaya. With an area of 172 sq. km and a population of more than 1.5 million people. Makassar is the seventh-largest city by population in Indonesia.
In 2013, the reclamation work of Makassar’s integrated global business strategic area called The Equilibrium CenterPoint Park (ECP) began, which is a reclamation project of the Center Point of Indonesia area and also other areas in the Makassar coastal area with a total area of around 1,000 ha and has been included in the Makassar Spatial Plan and Regional Plan in 2015. Currently, the construction of the CPI project is still ongoing and is planned to be completed in 2034. The total area of the CPI project is 157.23 ha. According to the agreement, the South Sulawesi provincial government will obtain 50.47 ha of land, the Makassar City Government 3.3 ha, and the remaining 106.76 ha of CitraLand City Losari (Fig. 1).
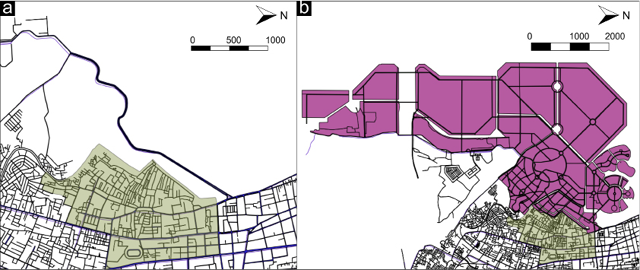
Source: Department of Public Works, Makassar City.
2.2. Space syntax
Space syntax is a method used to analyse and understand the spatial properties and relationships within built environments. It involves examining the configuration and connectivity of spaces, such as streets and buildings, to determine how they influence human experiences and behaviours. It has been applied in various studies to explore the experiential qualities of historical streets (Xu et al., 2021), describe the spatial properties of sustainable cities (Yamu et al., 2021), and identify and describe the spatial features of compact cities (Karimi, 2018; van Nes, 2021). Space syntax research has also focused on characterising and predicting socio-spatial experiences, examining the relationships between spatial properties and experiential values (Lee et al., 2023). In general, space syntax is a valuable method for understanding the impact of spatial configurations on human experiences and can inform urban design and planning decisions.
An axial map is one of the most crucial tools in space syntax. In this context, the spaces represented by the fewest and longest sight (and movement) lines on the map are considered to be publicly accessible. This represents or models the necessary relationship between the model and the real world (Joutsiniemi, 2005). The model is simpler than the real-world thing it represents. “An axial map is the minimal set of axial lines such that the set taken together fully surveils the system, and that every axial line that may connect two otherwise unconnected lines is included” is the general guideline that must be followed to create axial maps of built environments objectively (Turner et al., 2005). A model based on the linear link known as ‘integration’ is created by converting axial maps to graphs and conducting a topological analysis (Wagner, 2008). The concept of an axial line and its application in space syntax is explained, including the static measure of ‘connectivity’ and its meaning for axial integration analysis (van Nes and Yamu, 2021).
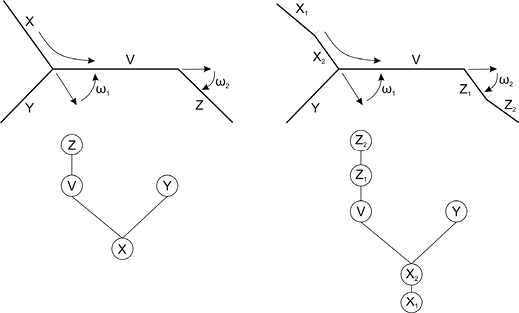
Source: own work.
Angular Segment Analysis (ASA) is used to compensate for the lack of geometric information (Dalton, 2001; Turner, 2007). The angular analysis contributes to the various integration analyses by weighting each segment line according to the angle of its connections to other segment lines.
Using the integration maps produced by the ASA analysis, the spatial syntax approach may be used to identify and categorise differences in the way that axes are used within a system according to their depth. The motion of the network inside the system is affected by these distinctions (Peponis and Wineman, 2002).
When calculating Total Depth (TD) in ASA, the angles formed by a turn from one space to another are considered. For example, in ASA, the TD of a segment x is as follows:
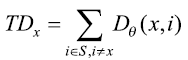
Where Dθ (x, i) is the depth found by taking into account angle (θ) for every turn made by taking the shortest angular route between segments x and i. The angle (θ) could range from 0 (no turn) to 2 (a 180° turn) (Jeong et al., 2015).
A significant metric for space syntax is integration, which is determined by calculating a space’s TD by the total number of spaces in the system. The integrating/segregating impacts of spaces in buildings or urban contexts are indicated by integration. The integration is as follows:

Where Ix denotes the integration value of space x, and NC indicates the node count (i.e., the number of nodes within a radius to be analysed) in a street network regarded as a graph consisting of a set of nodes and a set of edges (Jeong et al., 2015).
The integration value has two measurements. The first is the global integration value (Rn), which is defined as the number of connections a node has with all nodes in the system; the second is the local integration value, which is defined as the number of connections a node has with other nodes with a certain proximity in the system (Gann and Gann, 2003). Spaces that have a high degree of integration have a high movement rate, while spaces with a low degree of integration have a lower movement rate. This indicates that spaces with a high degree of integration are more connected and accessible (Hillier, 2001; Hillier et al., 1993).
The relationship between the several measures makes it possible to explain the properties and characteristics of a layout in relation to wayfinding (Dalton, 2001). Intelligibility is the correlation coefficient between connectivity and global integration. Intelligibility can help identify how easy (clear) it is for one in a local position to understand the global structure (Al-Sayed et al., 2014). In other words, Intelligibility can be understood as the relationship between a local measure, such connectivity, and the measure of integration in an axial map. This relationship allows an indicator to indicate how permeable and understandable a space is for users.
2.3. Analytical framework
This study aims to analyse the transformation of spatial configurations and evaluate the changes and expansions occurring over time. The focus is on the area surrounding the Center Point of Indonesia (CPI) project, which was incorporated into the Makassar City Regional Spatial Plan in 2015 and is projected to be completed by 2034. By comparing the spatial conditions between 2023 and 2034, the study assesses changes in spatial configuration, intelligibility, and accessibility in the CPI area, offering insights into the potential impacts of this major urban development on Makassar’s urban form.
Axial maps for both years were constructed and analysed using multiple radii: R250, R500, R750, R1000, R1500, R2000, R3000, and Rn. These radii enabled the evaluation of spatial qualities at both micro and macro scales. Key indicators analysed include global and local integration, intelligibility (INCO), and choice (INCHO). By comparing the results, the study identifies changes in pedestrian accessibility and road network efficiency over time (Fig. 3).
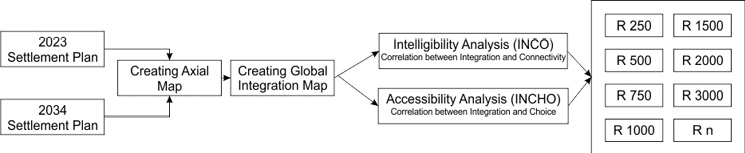
Source: own work.
By comparing the results of the analysis with the spatial sequence method, which enables the comparison of urban areas with diverse characteristics, this study aims to address the following questions in the context of Makassar:
- How do increasing urbanised areas influence the intelligibility and accessibility of the city’s spatial configuration?
- What are the impacts of past and present urban planning decisions on Makassar’s spatial structure and connectivity?
- At which spatial radius can optimal values of intelligibility and accessibility be identified using the spatial method?
The findings of this study are expected to provide insights into the key criteria and constraints that should be considered in future urban planning efforts for Makassar, ensuring a more integrated and sustainable urban development approach.
3. Results and discussion
This study examines changes in urban morphology, growth trends, intelligibility, and accessibility that occur in Makassar city. How and to what degree differences and changes affect the value of integration, followed by changes in the value of intelligibility and accessibility occur.
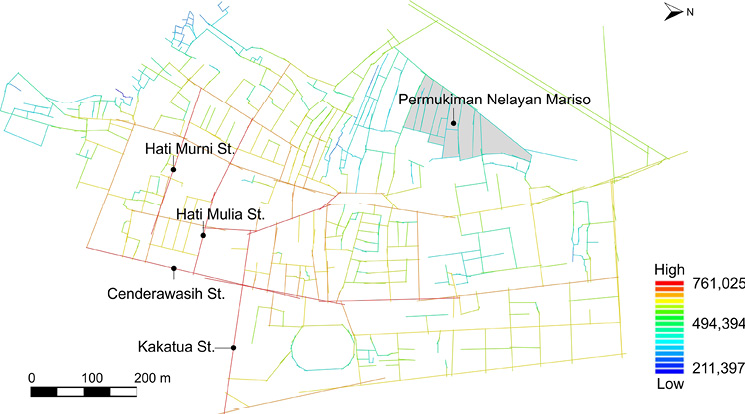
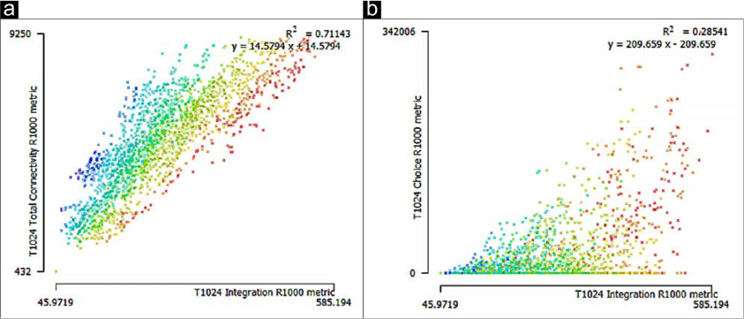
The average integration value on the 2023 integration map is 494.394 and the segment number was 2638 (Fig. 4). It can be seen that roads with high integration values are located on Cenderawasih Street (756.622), Kakatua Street (682.802), Hati Mulia Street (735.192), and Hati Murni Street (703.872), where many settlements are located around the axis of these streets, and this axis is the initial reference for the development of the surrounding area. While the Mariso fishermen settlement is an area with a fairly low integration value, Cendrawasih Street, Haji Bau Street, and Metro Tanjung Bunga Street are quite important roads that connect other settlements. The highest intelligibility and accessibility values in 2023 were achieved at a radius of R1000 with an INCO of 0.71 and an INCHO of 0.285 (Fig. 5).
Source: own work.
Source: own work.
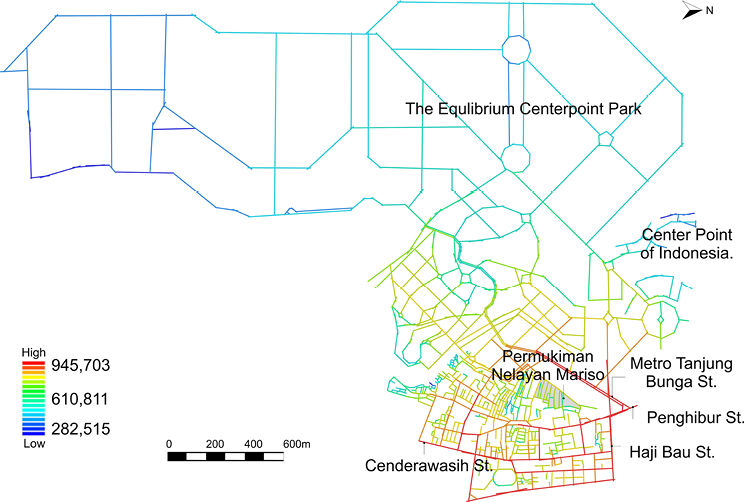
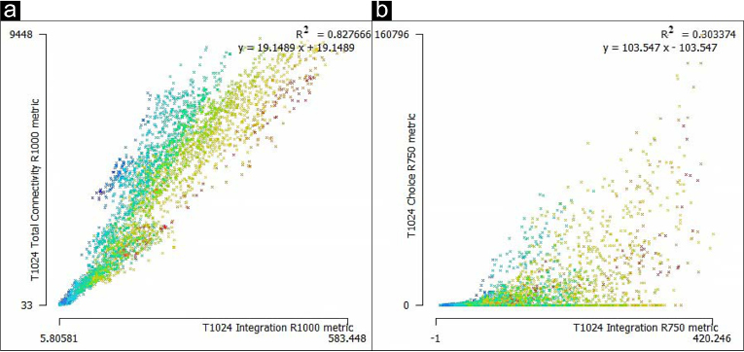
The average integration value in 2034 on the integration map is 610,811 (Fig. 6). The addition of a large enough space, namely the Equilibrium CenterPoint Park project, including Center Point of Indonesia, brings the number of segments to 3953. Cenderawasih Street (756,622) and Kakatua Street (682,802) are still the streets with high integration values. With this expansion, previously Metro Tanjung Bunga Street (553,111), Penghibur Street (701,121), and Haji Bau Street (652,082) became increasingly integrated roads with the values of Metro Tanjung Bunga Street (869,665), Penghibur Street (927,448), and Haji Bau Street (845,669). There is no significant change in the value of integration in the Mariso Fishermen Settlement. The highest intelligibility value in 2034 is achieved at a radius of R1000 with an INCO value of 0.827, while the highest accessibility value is at a radius of R750 with an INCHO value of 0.30 (Fig. 7).
Referring to Table 1, the intelligibility value at the Rn radius (global radius) in 2023 was 0.09 and experienced a slight decrease in 2034 to 0.06. Although not significant, at only 0.03, this confirms previous research conducted in European cities that there is an inverse relationship between intelligibility and urban growth (Dalton, 2011) also research conducted by (Günaydin and Yücekaya, 2020) in the city of Gaziantep, Turkey. The accessibility value at radius Rn in 2023 was 0.26 and decreased slightly in 2034 to 0.18, or a decrease of 0.08. Consistent with these findings, it seems that that accessibility decreases proportionally with the size of the city.
The decrease in the intelligibility value of 0.03 and the accessibility value of 0.08 is not very significant when looking at the number of segments, which increased by 1.5 times from the previous size.
Source: own work.
Source: own work.
The decrease in the value of intelligibility and accessibility can be explained by the fact that on the 2023 map there was no planning specifically related to existing settlements, while in 2034 there have been efforts for better urban planning, although it will be very difficult to change as a whole considering it is not easy to overhaul the configuration of the city that has been built.
In previous years, the growth of the area in Makassar City only grew organically and undirected. while on the 2034 plan map there have been efforts to arrange a more orderly city so that although there is a global decrease in the value of intelligibility and accessibility at Radius Rn, it is not so large compared to previous studies.
As described in the method and illustrated in Table 1, it is possible to determine which settlement plan achieves the highest value of intelligibility and accessibility, along with the corresponding radius. In this particular case, the settlement plan in 2023 achieved the highest value of intelligibility and accessibility both at a radius of R1000, while the settlement plan in 2034 achieved the highest value of intelligibility at a radius of R1000 and accessibility at a radius of R750.
The interesting thing is that although in the global radius (Rn) settlement planning in 2034, the intelligibility value has decreased compared to the 2023 settlement planning, the local intelligibility value has actually increased. Despite a 1.5 times increase in size, the intelligibility value of R250 actually increased from 0.64 to 0.73, the intelligibility value of R500 increased from 0.65 to 0.76, the intelligibility value of R750 increased from 0.70 to 0.80, the intelligibility value of R 1000 increased from 0.71 to 0.827, the R1500 intelligibility value increased from 0.49 to 0.795, the intelligibility value of R2000 increased from 0.26 to 0.76, and the intelligibility value of R3000 increased from 0.001 to 0.65. This shows that, at the local radius, there is an increase in the intelligibility value at each radius. Therefore, the statement that “intelligibility decreases with urban growthˮ is true, but it can be said that if the development of a city is well planned and designed, the intelligibility value can be improved or at least maintained even if the city expands.
Quite a different thing happened to the accessibility value; at a radius of R250–1000, there was an increase in the accessibility value. The accessibility value of R250 increased from 0.17 to 0.21, the accessibility value of R500 increased from 0.21 to 0.25, the accessibility value of R750 increased from 0.28 to 0.30, and the accessibility value of R1000 increased from 0.285 to 0.28. However, at a radius of R1500–3000, there was a decrease in the accessibility values. The accessibility value of R1500 decreased from 0.277 to 0.236, the accessibility value of R2000 decreased from 0.281 to 0.200, and the accessibility value of R3000 decreased from 0.26 to 0.15. This could happen because as the size of the area expands, affordability or accessibility at a radius of R1500 and above begins to decrease along with the increasing distance travelled. Even at a radius of R250–1000 in settlement planning 2034, there is an increase in the value of accessibility. This makes sense given that the size of the planned settlement increased by 1.5 times.
| Plan Year | Radius | Number of Segment | Global Integration | Local Integration | Intelligibility (INCO) | Accessibility (INCH) |
|---|---|---|---|---|---|---|
| 2023 | 250 | 2638 | 494.394 | 42.633 | 0.64 | 0.17 |
| 500 | 93.473 | 0.65 | 0.21 | |||
| 750 | 163.419 | 0.70 | 0.28 | |||
| 1000 | 241.846 | 0.71 | 0.285 | |||
| 1500 | 375.119 | 0.49 | 0.277 | |||
| 2000 | 446.551 | 0.26 | 0.281 | |||
| 3000 | 492.346 | 0.001 | 0.26 | |||
| n | 494.394 | 0.09 | 0.26 | |||
| 2034 | 250 | 3953 | 610.811 | 34.829 | 0.73 | 0.21 |
| 500 | 74.388 | 0.76 | 0.25 | |||
| 750 | 129.581 | 0.80 | 0.30 | |||
| 1000 | 191.956 | 0.827 | 0.286 | |||
| 1500 | 304.478 | 0.795 | 0.236 | |||
| 2000 | 385.203 | 0.76 | 0.200 | |||
| 3000 | 494.701 | 0.65 | 0.15 | |||
| n | 610.811 | 0.06 | 0.18 |
Source: own work.
This study’s findings demonstrate a significant decline in intelligibility and accessibility values at the global scale (radius Rn) as Makassar continues to grow. This observation aligns with Hillier (2001) analysis of 58 cities worldwide, where he found that cities with lower global integration and intelligibility values – particularly those in Arabia – often evolved based on spatial cultures that favoured organic growth over grid-like, planned development. Similarly, many Indonesian cities, including Makassar, have historically grown in an unplanned, incremental manner. This organic spatial culture tends to prioritise localised adaptations over systemic connectivity, which contributes to lower global integration.
In Makassar’s case, urban expansion has followed a pattern that reflects a reactive rather than anticipatory planning approach. The 2015–2034 spatial plan reveals that much of the new development is concentrated on the city’s western coastal area – land that was previously unoccupied or used for different ecological functions. This transformation is driven by spatial pressures such as increased demand for residential, economic, and social spaces, coupled with a limited supply of developable land in existing urban cores. The conversion of coastal areas, while providing short-term relief, may unintentionally disrupt spatial coherence at a city-wide level if not aligned with broader integration goals.
Notably, although intelligibility and global accessibility values decline with urban growth, the study also found an increase in local intelligibility and accessibility. This supports the argument that well-designed localised interventions can preserve or even enhance spatial legibility within neighbourhoods. Research by Günaydin and Yücekaya (2020), reinforces this finding, suggesting that while macro-level expansion may dilute spatial clarity, micro-scale planning (e.g., pedestrian-oriented design, connected street networks) can counterbalance these effects.
This duality emphasizes the importance of scale in spatial planning. While macro-scale disintegration poses challenges for wayfinding and mobility, local-scale improvements can contribute to urban resilience. For example, the integration of mixed-use corridors, transit-oriented development (TOD), and human-scale street networks – as observed in projects like the revitalisation of Kota Tua Jakarta or the TOD pilot zones in Surabaya – can improve neighbourhood connectivity and spatial intelligibility even within a rapidly growing city.
Therefore, to mitigate the declining spatial quality associated with urban expansion, Makassar’s planners should prioritise interventions that enhance specific spatial characteristics, such as permeability (ease of movement), connectivity (degree of interlinkage between streets), and visibility (clarity of spatial layout). Integrating these principles into current and future development – particularly in the CPI project area – can help preserve spatial logic while accommodating growth.
Moreover, the findings of this study highlight the need for urban planning policies that are not only responsive to physical expansion but also informed by spatial analysis tools such as space syntax. By using intelligibility and accessibility metrics as benchmarks for design interventions, policymakers can better evaluate the long-term spatial implications of their plans. This approach can serve as a foundation for more adaptive and context-sensitive planning in Indonesian cities.
4. Conclusion
This study aimed to analyse the transformations in the spatial configuration of Makassar City, particularly focusing on the changes in intelligibility and accessibility between 2023 and 2034. The findings reveal that the city’s expansion – especially into the western coastal area of Mariso district – results in a significant shift in urban connectivity. Notably, while the global intelligibility and accessibility values decreased due to the city’s expansion (1.5 times its current size), local intelligibility and accessibility values increased. This suggests that although large-scale urban growth can reduce spatial coherence at a global level, localised interventions can maintain or even improve accessibility and intelligibility within neighbourhoods.
The decrease in global intelligibility and accessibility poses challenges for urban planners, as it indicates that the spatial layout is becoming more fragmented, potentially hindering efficient movement and accessibility across the city. This could affect not only the ease of navigation but also social connectivity and economic activity. Therefore, future urban planning must address these issues by ensuring that main connectivity corridors, such as Cenderawasih Street, Kakatua Street, Metro Tanjung Bunga Street, Penghibur Street, and Haji Bau Street, are preserved and optimised. Maintaining these axes is crucial for ensuring seamless connections between different parts of the city, supporting both current and future growth while safeguarding the city’s overall spatial coherence.
In addition to the technical aspects of spatial design, the integration of Makassar’s historical and maritime identity should be prioritised. The preservation and connection of the Mariso fishermen settlements with new urban developments will help retain Makassar’s unique cultural and historical character, preventing it from becoming a fragmented city with little sense of place. Urban planners should consider not just the efficiency of infrastructure but also the social and cultural value of historic spaces.
While the study provides valuable insights into the future spatial configuration of Makassar, several limitations must be acknowledged. Firstly, the analysis relies heavily on quantitative measures from the Space Syntax software, which, although useful, does not account for qualitative aspects such as local community needs, social dynamics, or non-physical factors like cultural practices and behaviours. These variables, such as public opinion and the social and cultural context of urban spaces, are crucial for understanding the real-life impact of urban planning decisions. Furthermore, the study’s reliance on GIS data and software tools limits the generalisability of the findings to other cities with different spatial cultures or planning approaches.
To address these limitations, future research should incorporate more qualitative data, including surveys and community feedback, to gain a deeper understanding of how urban changes affect residents’ lived experiences. Additionally, the study’s findings could be extended to other cities with similar spatial configurations to assess the broader applicability of the proposed guidelines.
Finally, this study demonstrates that while urban expansion in Makassar may reduce global spatial integration, thoughtful planning and design interventions can enhance local intelligibility and accessibility. Planners, policymakers, and researchers from diverse fields should collaborate to ensure that the city’s growth remains inclusive, sustainable, and reflective of its cultural heritage. With a holistic approach, Makassar can maintain its maritime identity while accommodating future development needs, ensuring that the city remains accessible, integrated, and liveable for its residents.
Autorzy
REFERENCES
AL-SAYED, K., TURNER, A., HILLIER, B., IIDA, S. and PENN, A. (2014), ‘Space syntax methodology’, Bartlett School of Architecture, UCL: London, UK, https://www.researchgate.net/publication/295855785_Space_Syntax_methodology [accessed on: 03.07.2024].
BOEING, G. (2019), ‘Urban spatial order: street network orientation, configuration, and entropy’, Applied Network Science, 4 (1), 67. https://doi.org/10.1007/s41109-019-0189-1
DALTON, N. (2001), ‘Fractional configurational analysis and a solution to the Manhattan problem’, Space Syntax 3rd International Symposium, Atlanta, https://www.researchgate.net/profile/Nick-Dalton-2/publication/238787585_Fractional_Configurational_Analysis_and_a_solution_to_the_Manhattan_problem/links/0a85e53077648a7222000000/Fractional-Configurational-Analysis-and-a-solution-to-the-Manhattan-problem.pdf [accessed on: 03.07.2024].
DALTON, N. S. C. (2011), Synergy, inteligibility and revelation in neighbourhood places, Doctoral Thesis, UCL (University College London), http://discovery.ucl.ac.uk/id/eprint/1334117 [accessed on: 08.02.2024].
EL GOUJ, H., RINCÓN-ACOSTA, C. and LAGESSE, C. (2022), ‘Urban morphogenesis analysis based on geohistorical road data’, Applied Network Science, 7 (1), 6. https://doi.org/10.1007/s41109-021-00440-0
GANN, D. W. and GANN, D. W. (2003), Spatial integration: A space syntax analysis of the villages of the Homol’ovi Cluster, https://repository.arizona.edu/handle/10150/280412 [accessed on: 23.01.2024].
GHOSH, S. (2019), ‘A city growth and land-use/land-cover change: a case study of Bhopal, India’, Modeling Earth Systems and Environment, 5 (4), pp. 1569–1578. https://doi.org/10.1007/S40808-019-00605-Y
GÜNAYDIN, A. S. and YÜCEKAYA, M. (2020), ‘Evaluation of the history of cities in the context of spatial configuration to preview their future’, Sustainable Cities and Society, 59, 102202. https://doi.org/10.1016/J.SCS.2020.102202
HILLIER, B. (2001), ‘A theory of the city as object: or, how spatial laws mediate the social construction of urban space’, [in:] PEPONIS, J., WINEMAN, J. and BAFNA, S. (eds), Third International Space Syntax Symposium, Atlanta, GA: Georgia Institute of Technology, 2.01–2.28.
HILLIER, B., PENN, A., HANSON, J., GRAJEWSKI, T. and XU, J. (1993), ‘Natural movement: or, configuration and attraction in urban pedestrian movement’, Environment and Planning B: Planning and Design, (1), pp. 29–66.
JEONG, S. K., LEE, T. H. and BAN, Y. U. (2015), ‘Characteristics of spatial configurations in Pyongyang, North Korea’, Habitat International, 47, pp. 148–157. https://doi.org/10.1016/J.HABITATINT.2015.01.010
JOUTSINIEMI, A. (2005), ‘Generic accessibility challenges axial maps: case Helsinki’, 5th International Space Syntax Symposium, Delft University of Technology, Proceedings, Volume Ii, pp. 359–372, https://researchportal.tuni.fi/en/publications/generic-accessibility-challenges-axial-maps-case-helsinki [accessed on: 03.07.2024].
KARIMI, K. (2018), ‘Space syntax: consolidation and transformation of an urban research field’, Journal of Urban Design, 23 (1), pp. 1–4. https://doi.org/10.1080/13574809.2018.1403177
KOZHAKHMETOV, А. E. and ABILOV, A. Zh. (2022), ‘Understanding the city though the notion for liveable cities of jane jacobs and christopher alexander: public realm case studies in almaty (kazakhstan) and cardiff (the united kingdom)’, Қазақ Мемлекеттік Сәулет-Құрылыс Академиясының Хабаршысы, 84 (2), pp. 89–97. https://doi.org/10.51488/1680-080X/2022.2-07
LEE, J. H., OSTWALD, M. J. and ZHOU, L. (2023), ‘Socio-Spatial Experience in Space Syntax Research: A PRISMA-Compliant Review’, Buildings, 13 (3), 644. https://doi.org/10.3390/BUILDINGS13030644
LOBSANG, T., ZHEN, F. and ZHANG, S. (2019), ‘Can Urban Street Network Characteristics Indicate Economic Development Level? Evidence from Chinese Cities’, ISPRS International Journal of Geo-Information, 9 (1), p. 3. https://doi.org/10.3390/ijgi9010003
LU, J., LI, B., LI, H. and AL-BARAKANI, A. (2021), ‘Expansion of city scale, traffic modes, traffic congestion, and air pollution’, Cities, 108. https://doi.org/10.1016/J.CITIES.2020.102974
NOOR, W. and KAMAR, M. (2022), ‘The Role of Human Needs in Urban Renewal and Development of Urban Spaces for City Centers’, Journal of Engineering Research, 6 (4), pp. 143–157. https://doi.org/10.21608/erjeng.2022.265484
OKTAY, D. (2023), ‘Influences of urban design on perceived social attributes and quality of life: a comparative study in two English neighbourhoods’, Urban Design International, 28 (4), pp. 304–319. https://doi.org/10.1057/S41289-023-00218-Z
PARSIPOUR, H., POPOVIĆ, S. G., BEHZADFAR, M., SKATARIC, G. and SPALEVIC, V. (2019), ‘Cities expansion and land use changes of agricultural and garden lands in peri-urban villages (Case study: Bojnurd)’, Agriculture and Forestry, 65 (3), pp. 173–187. https://doi.org/10.17707/AGRICULTFOREST.65.3.14
PEPONIS, J. and WINEMAN, J. (2002), Spatial structure of environment and behavior, https://psycnet.apa.org/record/2002-02395-018 [accessed on: 03.07.2024].
PETROVA, V. and DVOINEV, V. (2020), ‘Urban Public Space of a Small City and the Needs of Residents in Realizing Practices of Socio-Cultural Interaction’, Bulletin of Science and Practice, 6 (1), pp. 325–335. https://doi.org/10.33619/2414-2948/50/41
PRELL, U. (2022), The City. https://doi.org/10.3224/84742612
SHYMKO, V. (2022), ‘A city as a space of communities. Methodical essay’, The Psychologist-Manager Journal, 9, pp. 72–82. https://doi.org/10.31499/2617-2100.9.2022.270051
SOLTANI, A., JAVADPOOR, M., SHAMS, F. and MEHDIZADEH, M. (2022a), ‘Street network morphology and active mobility to school: Applying space syntax methodology in Shiraz, Iran’, Journal of Transport & Health, 27, 101493. https://doi.org/10.1016/j.jth.2022.101493
SOLTANI, A., JAVADPOOR, M., SHAMS, F. and MEHDIZADEH, M. (2022b), ‘Street network morphology and active mobility to school: Applying space syntax methodology in Shiraz, Iran’, Journal of Transport & Health, 27, 101493. https://doi.org/10.1016/j.jth.2022.101493
TURNER, A. (2005), ‘Could a road-centre line be an axial line in disguise’, Proceedings of the 5th International Symposium on Space Syntax, 1 (4), pp. 145–159, https://discovery.ucl.ac.uk/id/eprint/39854 [accessed on: 03.07.2024].
TURNER, A. (2007), ‘From Axial to Road-Centre Lines: A New Representation for Space Syntax and a New Model of Route Choice for Transport Network Analysis’, 34 (3), pp. 539–555. https://doi.org/10.1068/B32067
TURNER, A., PENN, A. and HILLIER, B. (2005), ‘An algorithmic definition of the axial map’, Environment and Planning B: Planning and Design, 32 (3), pp. 425–444, https://discovery.ucl.ac.uk/624/1/turner05axial.pdf [accessed on: 03.07.2024].
VAN NES, A. (2021), ‘Spatial configurations and walkability potentials. Measuring urban compactness with space syntax’, Sustainability, 13 (11), 5785. https://doi.org/10.3390/SU13115785
VAN NES, A. and YAMU, C. (2021), ‘Analysing Linear Spatial Relationships: The Measures of Connectivity, Integration, and Choice’, Introduction to Space Syntax in Urban Studies, pp. 35–86. https://doi.org/10.1007/978-3-030-59140-3_2
VIDERMAN, T., KNIERBEIN, S., KRÄNZLE, E., FRANK, S., ROSKAMM, N. and WALL, E. (2022), ‘Urban Space Unsettled’, [in:] Unsettled Urban Space, pp. 1–15, Routledge. https://doi.org/10.4324/9780429290237-1
WAGNER, R. (2008), ‘On the metric, topological and functional structures of urban networks’, Physica A-Statistical Mechanics and Its Applications, 387 (8), pp. 2120–2132. https://doi.org/10.1016/J.PHYSA.2007.11.019
WANG, Y. P. and KINTREA, K. (2021), ‘Urban expansion and land use changes in Asia and Africa’, Environment and Urbanization Asia, 12 (1_suppl), S13–S17. https://doi.org/10.1177/0975425321999081
XU, Y., ROLLO, J. and ESTEBAN, Y. (2021), ‘Evaluating Experiential Qualities of Historical Streets in Nanxun Canal Town through a Space Syntax Approach’, Buildings, 11 (11), 544. https://doi.org/10.3390/BUILDINGS11110544
YAMU, C., VAN NES, A. and GARAU, C. (2021), ‘Bill Hillier’s Legacy: Space Syntax – A Synopsis of Basic Concepts, Measures, and Empirical Application’, Sustainability, 13 (6), 3394. https://doi.org/10.3390/SU13063394