
BLUE BANANA DYNAMICS AND THE PERSPECTIVE OF ITS EDGES
Luigi CAPOANI  *
*
Csaba LAKÓCAI *
Cristoforo IMBESI *
Violetta VAN VEEN *
Abstract. This paper investigates the positioning of the UK and Northern Italy within the Blue Banana, which the literature considers as the productive core of Europe. We compare the main economic characteristics of the two regions with the rest of the Blue Banana by analysing several indicators, ranging from urbanisation and infrastructure development to unemployment, productivity, competitiveness, and attractiveness. Based on our findings, in terms of population, urbanisation, and infrastructure, the Blue Banana and the two edges are still an integral part of Europe’s core. However, in terms of employment structure, productivity, competitiveness and attractiveness, its significance can be questioned due to the weaker performance of Northern Italy and the negative effects of Brexit.
Key words: Blue Banana, Northern Italy, Brexit, European integration, NUTS-2 regions.
1. INTRODUCTION
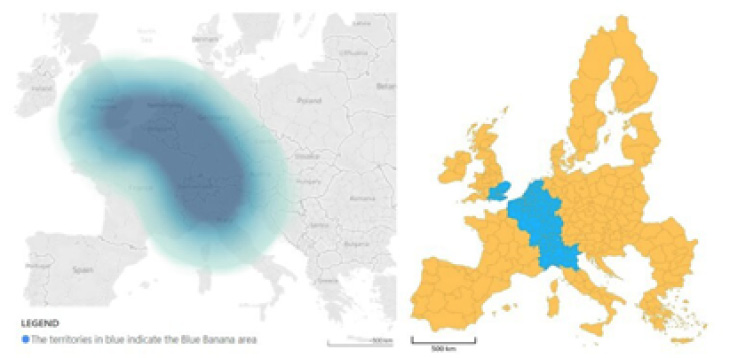
Brunet (1989) was the first geographer to identify a European productive core in a relatively narrow area, stretching from Northern Europe, including part of Great Britain, the Netherlands, Belgium, France, and Germany, to most of Northern Italy, while covering also Switzerland and Austria. He initially defined the area as ‘the European Backbone’, but since the late 1980s it has become commonly known as ‘the Blue Banana’, due to its shape. The Blue Banana is home to between 90 and 110 million people (out of Europe’s total population of 730 million) and covers 1,500 to 1,700 kilometres between its northern and southern edges. Different studies by scholars and academics have focused on the causes of the region’s remarkable levels of industrialisation and development (Kunzmann and Wegener, 1991; Hospers, 2003; Loriaux, 2008; Faludi, 2015; Nagy and Tóth, 2019).
Source: own work.
Before delving into our analysis, it is essential to provide a brief overview of the Blue Banana concept. Initially, the Blue Banana served as a springboard for studying the broader European development pattern. Nonetheless, over time, a new discussion on the historical context of European urbanisation emerged, a fact we will discuss in the next section. In our analysis, the Blue Banana emerges as a nexus of local production networks, where the clustering of industrial hubs catalyses the flow of capital and human resources, thus driving economic, industrial, and cultural advancements. However, the relevance of these districts extends beyond their mere size and population; it translates into a dynamic interplay of commerce and innovation that shapes the territory’s development trajectory.
Our research is driven by the need to update and refine the understanding of the economic and political dynamics within the Blue Banana. In particular, we will focus on its northern and southern extremities, whose features appear to be significantly peculiar. In this context, Italian industrial districts have risen to prominence over the past two decades, becoming central to discussions in business and economic forums. If we shift our focus to the other tip of the Blue Banana, it is worth considering the case of the UK as well. Approximately half of all jobs in the city of London are provided by over 800,000 small and medium-sized enterprises (SMEs), which account for 99.8% of the city’s businesses (Hutton, 2024). Outside the Central Activities Zone – the very centre of the city of London – the capital’s industrial areas account for 11% of all jobs, or around 556,000 positions spread across 34,720 businesses (Hutton, 2024).
Nonetheless, recent developments, especially Brexit negotiations and Italy’s economic vulnerability, have underscored the need for a nuanced analysis of this area’s trajectory. Italy’s potential drift from its position within the Blue Banana – related to its loss of competitiveness in the market – and the repercussions of Brexit that are currently affecting the UK, present critical challenges with far-reaching implications for EU Member States. These developments are in fact reshaping the economic landscape of the area (see further). Thus, the article discusses these aforementioned current events in both the southern and northern edges of the Blue Banana, with a particular focus on Northern Italy and London and South East England. Moreover, our research will lead to interesting findings on Eastern Europe’s backbone as well, highlighting it as one of the most dynamic and transformative regions in Europe.
The paper is structured as follows: After a brief overview of the Blue Banana concept and its historical evolution, we analyse and compare the basic characteristics of the area with those of Northern Italy, expressing our concern about whether the territory can still be considered part of the region. The specific focus is on the north of the country, where technological districts are larger, closer to the local economic structure, and exhibit greater sectoral diversity compared to those in the rest of the country (Bertamino et al., 2016). Regarding the position of London and South East England within the Blue Banana, the final section of our paper shows potentially serious concerns raised by the Brexit negotiations, as productivity is expected to fall and the interconnections with the rest of the Blue Banana are destined to become more difficult (Bloom et al., 2019; Sedláček et al., 2019).
2. HISTORY OF THE BLUE BANANA
The concept of the Blue Banana was first introduced in a study conducted in 1987 by the Interministerial Delegation of Land Planning and Regional Attractiveness (DATAR) and, as mentioned, presented by Brunet and his geographers in 1989. Brunet’s work was developed in a period of significant advancements in the establishment of a European single market and in the strengthening of European integration, namely through the Schengen Agreement and the signing of the Single European Act.[1]
Over time, criticisms of the Blue Banana concept have nonetheless intensified. Firstly, after the fall of the Iron Curtain in 1989 and in the early stages of the creation of the EU economic and monetary union, the determination of an economic core within Europe was said to reduce the cooperation and increase rivalry between Member States (Kunzmann and Wegener, 1991; Dunford, 1994). Furthermore, recent studies have challenged Brunet’s argument, as the manufacturing and logistics core of the European Union is moving eastwards (Naudé et al., 2019, p. 6; Csomós and Tóth, 2016). Additional studies have been directed at the shape of geographical areas, such as Nagy and Tóth’s (2019) discussion on an alleged “New Banana”, a promising European economic core consisting of seven capital cities and their agglomerations: Berlin, Prague, Bratislava, Vienna, Budapest, Ljubljana, and Zagreb. Other studies have examined a potential “Sunbelt” from Milan to Valencia, and a “Yellow Banana” from Paris to Warsaw (Hospers, 2003; Nagy and Tóth, 2019).
In the early 1990s, Kunzmann and Wegener (1991) proposed an opposing theory introducing the concept of the Bunch of Grapes. This idea identifies a different pattern of European development based on multiple centres, where new areas of development were integrated by simply adding more berries to the original ‘grape’. In this way, countries and regions of Eastern Europe could easily be combined into the picture, giving shape to a clear and straightforward framework, in line with a new polycentric European development strategy (Faludi, 2015). However, despite the emergence of new dynamic corridors of economic development, the Blue Banana continues to be seen as the core of the European economy.
3. MODERN INDICATORS OF THE BLUE BANANA
Throughout the analysis, we consider four main areas to measure whether Northern Italy, London and South East England can still be considered part of the Blue Banana: productivity and competitiveness, urbanisation and infrastructure, employment – especially in capital-intensive sectors – and the related attractiveness of high-skilled migrants. In this paragraph, we illustrate the reasoning behind the choice of these key features and metrics in order to define the economic and productive core of Europe.
The growth of this area and its internal competitiveness are essential features of the European landscape. According to the EU Regional Competitiveness Index, which will be discussed later, most of the European Backbone regions score well above the European Union average in this regard (Table 1). However, new production centres are gradually emerging in the East, particularly in the industrial sector. According to Hospers (2003), if manufacturing is shifting eastwards, it is easy to see how the major European centres have made the transition from manufacturing-oriented societies to service-oriented types of economies (Faludi, 2015). By the late 1980s, a new urban geography with a focus on tertiary jobs and advanced manufacturing developed, particularly in the wake of the deindustrialisation crisis in Western Europe. London and Paris were at the top of the new international paradigm, and other cities, which chose to pursue service-oriented local policies, could be found along the “Blue Banana axis”, starting from Manchester (Kazimierczak, 2014) down to Turin (Scamuzzi, 2022). In the expanding eastern centres, where primary and secondary industries have historically predominated, services have also become increasingly important. The internationalisation of these countries’ economies is mainly responsible for the growing importance of services such as marketing, finance, and consultancy.
The second factor worth considering is the phenomenon of urbanisation, which has always been one of the most prominent features when identifying the Blue Banana. This factor, alongside other economic and infrastructural characteristics, distinguishes the area from other European regions. First and foremost, it is densely populated and urbanised, with 40% of the EU’s population residing in numerous large and medium-sized cities within the delimited area. In this respect, it has also been referred to as the European Megalopolis by some scholars (Kunzmann, 2007; Faludi, 2015). The Blue Banana is visible on the regional map of Europe by connecting the darker blue areas in Fig. 1: these are the most densely inhabited centres, and they include major cities like Amsterdam, Dortmund, and Düsseldorf.[2] In addition, Milan, Varese, and Monza-Brianza can be considered as some of the most populous provinces.
To fully grasp the extent of the influence of urbanisation, it is instructive to consider the theory of growth poles, a concept that has been pivotal in understanding the dynamics of regional growth. As articulated by Perroux (1950), growth poles are catalysts within an economy, consisting primarily of influential enterprises, industry sectors, or academic and research institutions. These poles serve as epicentres of economic activity, exerting a ripple effect that spurs expansive growth throughout their surrounding areas. Jacobs (1969) contributes to this strand of literature by associating technological progress with the benefits of urban economies. Urban centres are crucibles of diversity, offering a confluence of new opportunities that can be harnessed into tangible economic growth. This synergistic relationship between urbanisation and technological innovation is a fertile ground for economic development. Although these effects might not be immediately apparent, they are of paramount importance. On this subject, Florida (2002) has envisioned cities as engines of wealth through technology, talent, and tolerance, where, however, patterns of inequality tend to emerge: only a small number of neighbouring cities have gained the benefits of economic development (Florida, 2017).
Moreover, according to Hospers’ (2003) analysis, the development of physical and telecommunications infrastructure is a key feature of the Blue Banana. For instance, this area exemplifies how urbanisation, population density, and economic growth drive the demand for a well-developed transport system (Van Wee et al., 2013). Consequently, investing in infrastructure is key to economic development, especially when it comes to trade and GDP (Gross Domestic Product) growth (Röller and Waverman, 2001). We can assess both direct and indirect effects in sectors related to construction, civil engineering, electronics, real estate, and environmental preservation. For example, political instability, variations in maintenance, and discontinuous investments have a detrimental influence on railway usage; in contrast, continuous investments and proper maintenance assure a progressive growth in the number of people and products moved. This is a consistent trend, and from an economic and ecological standpoint, it can be regarded also as a positive phenomenon (Cermakova et al., 2015).
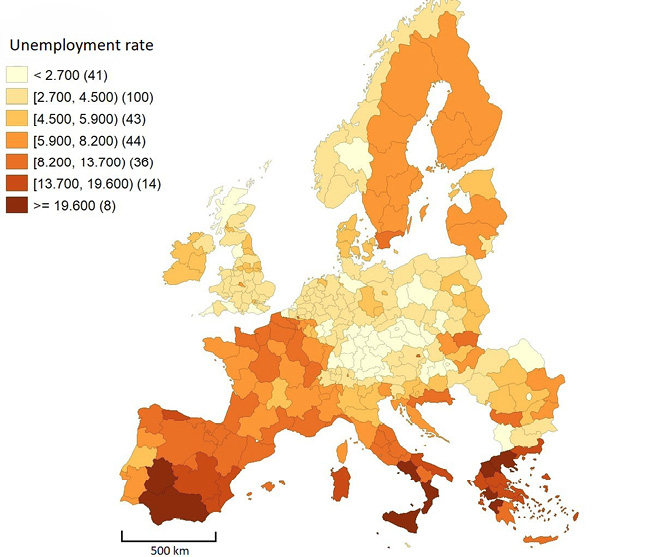
Measuring innovation through employment indicators is challenging as well. For example, the unemployment rate by itself does not provide a comprehensive picture of the regional economic situation in terms of sectoral balance. On the contrary, metrics like the proportion of employment in knowledge and high-tech industries relative to the overall occupation are more systematic parameters (see Appendix), which can lead to the achievement of an accurate representation of the regional employment landscape. For instance, central-eastern European regions seemingly perform better than most of the western European regions when only considering the employment rate. However, this is due to the higher dependence on FDI and the less productive industrial manufacturing sectors in the eastern periphery compared to the core of Europe. Concerning the rate of employment in high technology and knowledge-intensive sectors, the picture is geographically more dispersed. In other words, it can be said that the Blue Banana is not the main and only European core according to this indicator.
Source: own work based on Eurostat data.
An additional and relevant indicator for our research purpose concerns the concept of attractiveness. Although mobility is mutually beneficial for both mobile workers and employers, it is a zero-sum game across sending (brain-drain) and receiving (brain-gain) entities, as clearly detailed in the “war for talent” argument (Michaels et al., 2001). According to Marini (2024), this dynamic is also evident at the EU level for semi-peripheries. Besides wages and other socio-economic motives, the literature identifies additional soft elements influencing international mobility. Musolino and Kotosz (2024) have identified various factors that influence territorial attractiveness, ranging from financial resources, such as investment flows, to the movement of people, including tourists, immigrant workers, and specific groups like researchers, talents, and university students. The latter categories, specifically immigration and talents, will be the focus of our indicator of attractiveness.[3]
In conclusion, another indicator considered to assess whether an area belongs to the Blue Banana is its efforts in tackling pollution and other initiatives related to the models of circular and green economies. Indeed, as previously examined, there is a positive correlation between economic growth and urbanisation. However, it is worth noting that these two variables will contribute to pollution in urban areas. This phenomenon will be further examined through the subsequent analysis of the cases of Northern Italy and London.
4. IS NORTHERN ITALY FACING THE RISK OF EXITING THE BLUE BANANA AREA?
Since the European financial and economic crisis of 2008, the transformation of the Blue Banana area has been both profound and multifaceted. This once predominantly linear economic corridor has evolved, adopting a more polycentric structure that extends beyond its original borders. This shift has been particularly pronounced with respect to the Mediterranean regions, which have seen their influence fluctuate in recent years within the Blue Banana landscape.
Indeed, while many of the northern countries included in the Blue Banana have succeeded in following the path of stability, Italy has not moved in such a direction, raising questions about whether its presence inside the Blue Banana is still well-founded. We will investigate this inquiry in the following section of the paper, by separately examining each determinant presented in the previous section. As mentioned earlier, the Blue Banana has several distinctive characteristics that contribute to its reputation as the beating heart of Europe.
4.1. Productivity and competitiveness
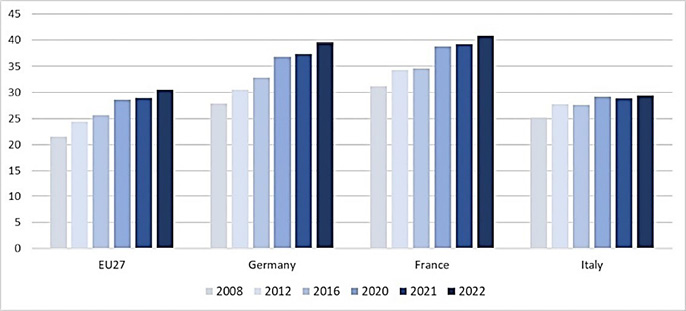
This first section focuses on labour costs and productivity in Italy. Although the Southern country’s related units are significantly higher than those in other Eurozone countries, labour costs are still rising (De Grauwe, 2007) due to decreased productivity, despite the fact that Italian salaries are lower than in the broader area. Additional empirical evidence comparing Italy to other EU members with similar GDPs, such as France and Germany, shows that the country is an exception (Calcagnini and Travaglini, 2014; Lotti and Santarelli, 2001; Sterlacchini and Venturini, 2014). Indeed, Italy is the only country where labour productivity growth rates have consistently slowed down over the past three decades (see Fig. 3). This is further evidenced by the decline in technological improvement within the same time framework (Sgherri, 2005). According to Eurostat data, Italy’s labour costs have risen less than those of France and Germany (Fig. 3), despite its labour productivity decreasing more (Fig. 6) over the last one and a half decades.
Source: own work based on Eurostat data.
Labour market reforms can be quite important in boosting employment. However, resulting from policies favouring flexible labour arrangements, the capital-to-labour ratio has decreased and the proportion of unskilled workers working shorter shifts has increased (Saltari and Travaglini, 2008). Malcolm Abbott (2018) have noted that there are various methods to assess productivity, depending on the justification for their measurement. Among them, one can assess the business birth rate, which is defined as follows:

(1)
In the equation above, the number of enterprises founded in one year is divided by the total number of active enterprises over the same year in order to measure entrepreneurial activity. In relation to our study, the regions in Eastern Europe have the highest birth rates in enterprises, while the Blue Banana finds itself on the same level as the average European score (Table 1). Nevertheless, Northern Italy’s birth rate is located below the Blue Banana average (Table 2), seemingly supporting the concept of “lock-in context” (Calcagnini and Travagnini, 2014; De Noni et al., 2017). This makes them risk-averse, as they are unable to take advantage of the process of creative destruction by experimenting with fresh growth prospects.
A commonly accepted definition of competitiveness includes the willingness and aptitude to gain and maintain a place in the market, to increase market share and profitability, and ultimately to combine operations that are profitable at a commercial level (Annoni and Dijkstra, 2017). However, there are some nuances to consider. Firstly, the concept was initially developed to compare firms and not regions, thus raising the question of its possible applicability at the regional level to explain economic performance. Some scholars (Cellini and Soci, 2002; Krugman, 1994) argue that countries or regions, unlike firms, have different objectives beyond profit and that international trade is not a zero-sum game. However, other authors (Boschma, 2004; Turok, 2004) point out that investments and key resources are exiguous, and territories (either countries or regions) seek to attract them through competitive behaviour. The definition adopted by the EU Regional Competitiveness Index 2019 (Annoni and Dijkstra, 2019) partly helps to balance these two perspectives, as it integrates the well-being of both firms and citizens in the region without focusing only on the former (as highlighted by Schwab, 2012; Porter et al., 2007), or only on the benefits of the latter (as pointed out in Meyer-Stamer, 2008). As competitiveness is a compound indicator, it should include various factors that can be empirically tested, such as human capital and institutional quality, as well as productivity-related aspects like R&D expenditure or the number of NEETs.[4]
Bristow (2010) has pointed out that sources of competitiveness can be found not only at the regional level, but also at local (as in the case of a city) and national ones. For example, the effect that federal laws have on states or similar territories may be significant. To achieve this, the Regional Competitiveness Index (RCI) considers several indicators, including labour market efficiency, institutional quality, research, technological infrastructure, health, education, market size, macroeconomic stability, and GDP per capita. It also uses a system of different weights to account for different types of legislation (Annoni and Dijkstra, 2019). It is extremely important to consider the concept of competitiveness, since in recent years our society heavily relies on creativity in a variety of fields, including science and engineering, technology-based businesses, as well as in art and music, or even in knowledge-based professions like finance, law, and healthcare (Florida and Tinagli, 2004). Nowadays, creativity is not just a method to enhance output, but it has become a driving force behind business (Hightower, 2003) and the key to gain competitive advantage (Junarsin, 2009).
From a historical perspective (see Table 2 in the Appendix), we can observe how the deterioration of competitiveness in Italy is anything but a recent phenomenon. In both the 2000–2009 and 2010–2019 decades, Northern Italy performed worse than the rest of the Blue Banana in several fields: enterprise birth rate, gross value added at basic prices, fixed capital formation and compensation of employees. However, for the last two factors, the gap with the Blue Banana is lower in the 2010–2019 period compared to 2000–2009. The only exception to this trend is the employment in technology and knowledge-intensive sectors, which is higher in the North of Italy than in the rest of the Blue Banana.[5]
As suggested by Bull (2018), the reasons for these inefficiencies can be found in the country’s long-lasting structural weaknesses, dating back to the 1990s and further exacerbated by the sovereign and debt crises. In 2016, the region Lombardy scored between 0 and 0.2 on the index, while the other northern areas scored slightly higher, between 0.2 and 0.5. Comparing these values with the 2013 index, we can see that the score for Lombardy has remained essentially unchanged (0–0.2), while the other regions in Northern Italy have become slightly more competitive in 2016, since in 2013 their average score was -0.2–0. In the 2010 edition of the RCI, Lombardy and Emilia-Romagna seemed to belong to the Blue Banana, as their indices were almost in line with the rest of the most developed regions (0.2–0.4).
From a methodological perspective, as far as the different index’s components are concerned, we can identify three RCI sub-indices – Basic, Efficiency, and Innovation. The first group includes fundamental enablers of competitiveness, such as infrastructure, health, and education, some of which are nationally computed. The Efficiency sub-index more closely measures dimensions linked to productivity, such as lifelong learning, market size, and labour market efficiency. In all these areas, the aforementioned ‘lock-in effect’ of Italian enterprises had a primary role, since the academic pressure to promote competitiveness by shifting the support from traditional industries to the increased size of national firms has gone largely unheeded (Calcagnini and Travagnini, 2014).[6] Finally, the Innovation sub-index measures more specific factors, such as business sophistication (the percentage of small and medium-sized enterprises that introduce marketing or organizational advancements) and innovation.
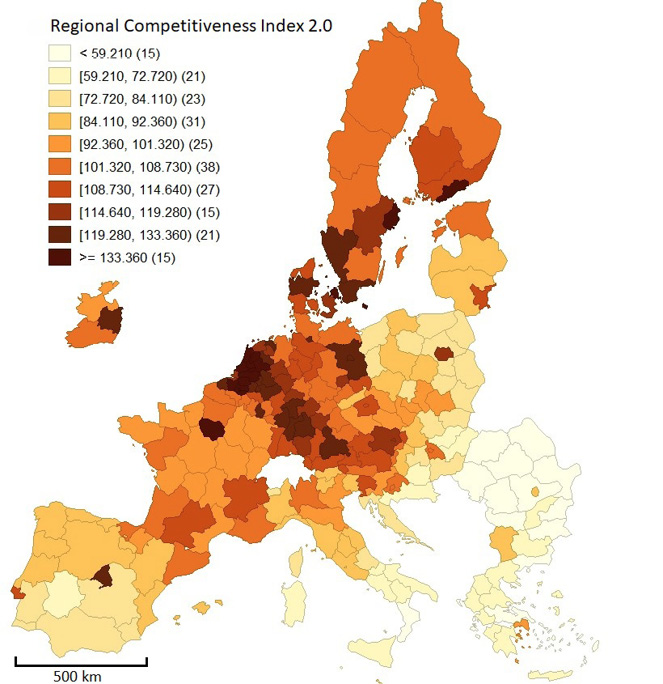
In the Italian case, the significant number of small and medium-sized enterprises has further limited the various facets of innovation, culminating in low-interest rates and therefore low investment in research and education (Bull, 2018). Northern Italy lacks adequate education standards as well as macroeconomic stability. In this respect the 2018 report of the Programme for International Student Assessment (PISA) provided student learning outcomes assessment in reading, mathematics, and science (OECD, 2019). It is important to note that the RCI’s methodological framework has changed since 2022.[7] Figure 4 displays the EU NUTS-2 regional data for 2022 based on the current edition, in relation to RCI 2.0, even though we have already studied the data based on earlier editions.[8] According to the new dataset, Lombardy still performs better than most of the EU regions, but worse than other neighbours within the Blue Banana area, thereby suggesting that the region represents a borderline case.
Source: own work based on European Commission (n.d.) data.
4.2. Urbanisation and infrastructures
Regarding the development of urbanisation and infrastructures, coherently with Klasen and Nestman (2006), data clearly shows that variations in productivity and occupation are fast moving processes compared to, for example, changes in population density. Given that the inhabitants of these areas do not move to different regions as a direct response to economic development, it is not surprising that Northern Italy still has a considerable density of cities, despite lower competitiveness, especially considering how long ago urbanisation started (Faludi, 2015).
In terms of infrastructures, when examining comparative data among European nations, the focus often falls on metrics like the extent of the railway network. In this aspect, Italy’s railway infrastructure has traditionally trailed behind its Blue Banana counterparts. Yet, this disparity has shown signs of narrowing in the decade spanning from 2010 to 2019, as opposed to the previous decade, a trend highlighted in Table 2. Beyond the basic measurement of rail length, Northern Italy’s integration into the Blue Banana is more comprehensively understood through its capabilities in passenger transport and the linkage of urban centres. Lombardy stands out as a seamlessly integrated region within the Blue Banana framework. This is attributed to the presence of pivotal intermodal centres in locations such as Busto Arsizio-Gallarate and Milano-Melzo. These nodes have gained recognition as substantial logistical pivots, contributing to the fabric of transportation and commerce across the area, as detailed by Pastori et al. (2014). These intermodal hubs exemplify Northern Italy’s strategic role in enhancing connectivity and facilitating the flow of goods and people within the Blue Banana.
The Northern Italian area is also an advantageous location for connecting shipment flows from Austria, Germany, and France. This characteristic, along with its industrial progress over decades, accounts for the growth of the area’s logistics industry (Lupi et al., 2018). Hence, we can state that Northern Italy still finds its place in the productive region of the Blue Banana according to the infrastructure parameter (Schade et al., 2016). However, Italy’s potential exclusion from the Blue Banana area is primarily due to other economic factors identified in Section 3, such as productivity, introduced in the previous paragraph, and employment, which will be analysed in the following one. Moreover, a crucial component worth considering when addressing the parameter of urbanisation is the issue of environmental pollution, as environmental risks may affect individuals’ residential choices. A negative and statistically significant relationship between local air pollution and the net migration rate is found among Italian provinces (Germani et al., 2021), highlighting that environmental variables must be taken into account as an indicator of quality of life when analysing the phenomenon of internal migration (Bonasia and Napolitano, 2012).
4.3. Employment and welfare
From 1996 onwards, Italy experienced an employment rate growth of an average of 1.1% (Faini, 2003). Moreover, the later introduction of the euro seemed to balance not only Italy’s unemployment rates, but also those across the whole Eurozone. However, even before the 2008 crisis, there was an increase in joblessness disparity (Puga, 2002; Beyer and Stemmer, 2016), resulting in heterogeneity in unemployment rates within the region.
Therefore, is the unemployment rate different in Italy than in the other Blue Banana countries? To analyse the heterogeneity peculiar to the Blue Banana, factors such as flexible labour markets, interregional transport connectivity, and local access to skilled workers, should be considered as well (Andersson et al., 2015). In this context, the relatively low unemployment rate may be attributed to a territory’s well-developed infrastructure network and highly skilled workforce.
Evidence suggests that, after the introduction of the single currency, while Southern European countries, such as Spain and Greece, experienced a decline in their unemployment rates, but this was not the case in Italy (De Grauwe, 2007). Indeed, the 2014–2015 Jobs Act in Italy was intended to bring the labour market institutions closer to the standards of the EU and those of the Blue Banana (Pinelli et al., 2017). At least for the first period, the hoped-for positive consequences were reached. However, it is worth considering that regional differences in unemployment rates led to unequal effects across the country, and Northern Italy particularly enjoyed most of these positive consequences (Marino and Nunziata, 2017). Comparing the Blue Banana and Northern Italy between 2011 and 2013, it could be assessed that the share of unemployed people in the latter was approximately in line with the statistics of the rest of the area. Nevertheless, it was still 1–2% higher than in other Blue Banana countries, confirming the literature on the longer-lasting effects of the 2011 Italian crisis. However, unemployment rebounded, reaching pre-crisis unemployment levels in 2017 and 2018 (Bull, 2018; Moschella, 2017; European Commission, 2017). Despite all this, it should be recalled that these figures come from the most productive part of Italy: the rate remained significantly higher in the Centre and in the South of the country (Marino and Nunziata, 2017). Finally, in 2019, before the COVID-19 pandemic, the unemployment rate in Northern Italy was not different from the percentages of Western European regions outside the Blue Banana, but it was higher than in the countries inside it (Fig. 2). However, as mentioned earlier, it should be emphasized that the unemployment rate alone does not give a good picture of the regional economy in terms of sectorial balance.
4.4. Attractiveness and migration
As mentioned in Section 3, territorial attractiveness plays a pivotal role when assessing Italy’s position in the context of the industrialised core of Europe. This section focuses on the analysis of the attractiveness determinant and the resulting migration patterns based on the most recent literature.
According to a study from Musolino and Kotosz (2024), Lombardy consistently ranks at the top and far above the other northern regions throughout the whole time period under analysis.[9] Besides being the main gateway for multinational companies in Italy (Mariotti, 2017), Lombardy is well-known for attracting both foreign labour force and university students. By scrutinising the broader northern area, we can identify a group of regions following Lombardy’s example, namely Trentino-Alto Adige, Friuli-Venezia Giulia, Piedmont, and Emilia-Romagna. Besides the good level of attractiveness for foreign immigrants, the strong tourist vocation of many of these Italian regions is a determining factor for the outstanding rankings of these regions.[10] Moreover, many of them are also rather attractive for FDIs, albeit at a lower level than Lombardy. From an academic perspective, the presence of important and prestigious universities, such as the historic university of Bologna in Emilia-Romagna, surely contributes to increasing the appeal of these regions.
In order to better assess the position of the Italian northern regions within the broader industrialised core of Europe, it is worth mentioning the status of the country’s southern regions, which rank at the bottom of the list. They are neatly divided from the rest of Italy: only Calabria obtains a higher score, due to the good performance in attracting university students and foreign workers from abroad (Musolino and Kotosz, 2024). In this respect, Musolino and Kotosz (2024) have found that the two macro-regions (Central-North and South) do not differ so neatly in terms of multidimensional international attractiveness. Instead, disparities and different patterns within the country continue to grow more complex, as also recent works on the middle-income trap and development trap of the European regions, including in the Italian context, have highlighted (Diemer et al., 2022).
5. BREXIT AND SOUTH EAST ENGLAND’S EXIT FROM THE BLUE BANANA
This section provides an overview of the consequences of Brexit negotiations for the Blue Banana, focusing on the effect of negotiations rather than on Brexit itself. This focus is due to the lengthy withdrawal process from the European Union, which ended only on 31st January 2020. Furthermore, it is undoubtable that the worldwide pandemic presented a serious risk to the economies of the United Kingdom and the Blue Banana. Given the interwoven consequences of Brexit and COVID-19, determining the event’s repercussions is difficult. Our analysis’ first step includes the evaluation of the impact of Brexit, bargaining on the indicators that we have identified in Section 3, namely productivity and competitiveness, infrastructures, attractiveness and migration. The second step involves considering the consequences of Brexit on the free flow of goods and people. The evidence indicates that Brexit had a significant and irreversible impact on the regional cohesion of the Blue Banana, despite the UK’s economic recovery.
5.1. Productivity and competitiveness
The direct consequences of the Brexit bargaining process on national trade should be initially acknowledged in terms of productivity and competitiveness.
Since 2015, trade has been a major concern, as the EU has always been the largest trading partner for the UK until Brexit (Dhingra et al., 2016). In this regard, the agreement reached on 30th December 2020 assured that no tariffs or quotas would be implemented by either party (Part III: Separation Issues), with minor exceptions. At the borders, though, customs declarations and security checks would be implemented. Coupled with origin rules and regional variations in product safety and standard laws, these are some of the primary causes of non-tariff barriers (Dhingra et al., 2016). Furthermore, policies affecting small businesses have an impact on exports since they now have to comply with paperwork and customs rules (Bailey et al., 2023). In addition, the most significant impact in the services sector is that British firms will lose their automatic right of access to EU markets and will have to comply with different regulations in each country. Although inherently more complex to measure, the impact is far-reaching: Byrne and Rice (2018) estimated a 9.6% decline in trade flows, and a similar result (10%) was found by Ottaviano et al. (2014), taking into account the potential loss from further non-tariff barrier reduction for EU Member States. However, some scholars consider these figures to be overvalued, as the benefits from the single market have been weaker for the UK than for the average of EU Member States (Coutts et al., 2018).
Competitiveness is directly related to the parameter of productivity: in fact, a smaller market would reduce competitive pressure. According to classical international trade theory (Krugman et al., 2009), the results would consist in the survival of the less efficient firms in the market and a decline in productivity growth. The latter, in its value-added measure, is estimated to have fallen by about 1% per year after 2016, when Brexit negotiations began, for firms less affected by them. On the one hand, as employment did not fall, labour productivity decreased (Bloom et al., 2019). On the other, as expected, the most productive firms were the most affected by the Brexit bargaining process (Krugman et al., 2009). Indeed, these firms typically have the highest propensity to trade. Therefore, Brexit negative effects on trade led to a decline in their productivity, with several sectors experiencing decreases up to 2.27%, including textiles, chemicals, motor vehicles, and electronics (Latorre et al., 2020).
Brexit-related challenges have resulted in a considerably smaller market for UK businesses to offer their goods and services which has caused them to lose economies of scale and negatively influenced their efficiency (Mathieu, 2020). Since significant investments may only be amortised in the event of strong sales, a lower degree of economic openness would hence hinder the kind of technological innovation and the ability to import it. As a result, uncertainty becomes a crucial factor affecting the scale of investment decisions (Fuss and Vermeulen, 2008). The unpredictability generated by the Brexit deal bargaining has gradually reduced investments by approximately 11% over the three years following the June 2016 vote (Bloom et al., 2019). Additionally, preparations to complete all the time-consuming Brexit processes, which opened different scenarios, also had a negative impact on firms’ time management. In this respect, Bloom et al. (2019) have pointed out that between November 2018 and January 2019, 10% of the CFOs and 6% of the CEOs spent more than 6 hours per week preparing for Brexit. As a consequence, less productive companies entered the British market due to protectionist policies and lower levels of imports, resulting in less competition (Latorre et al., 2020). On the one hand, this would have a lasting impact not only on the current GDP level, but also on the GDP growth rate. On the other, productivity growth is already slowing down in more advanced countries (Bergeaud et al., 2016). Therefore, the impact of economic openness on productivity may be lower than expected (Mathieu, 2020). However, while comparable data on the gross value added at basic prices, gross fixed capital formation, and compensation of employees are not available for the UK, the share of human resources in science and technology is still lower than in the rest of the Blue Banana, but with a significant increase in the 2010–2019 period compared to 2000–2009 (see Tables in the Appendix). In this respect, as in the case of Italy, it is worth considering the issue of pollution as well. Since Brexit, water corporations have been allowed by the government to discharge untreated wastewater into the environment due to the lack of treatment chemicals. Consequently, raw sewage has been circulating in UK rivers and in the sea.
5.2. Infrastructures
In terms of infrastructure, the agreement on transport commits both parties – the EU and the UK government – to continue to provide air, road, rail, and maritime connectivity, although market access is now more difficult for the UK than for the EU member states participating in the single market. This is clear in the domain of air transport, which is crucial for the UK, with Heathrow being the first international airport in Europe by number of passengers before Brexit (Airports Council International, 2015). Indeed, it is worth remembering that the UK has left the 2007 Open Skies agreement between the US and the EU, which ensured that aircrafts did not require extra regulatory clearance to operate between participating nations. The EU continues to play a significant role in this domain, even though the matter is frequently governed at the United Nations (UN) level.
As far as standards on interoperability in the railway sector are concerned, trains should be able to run on all EU rail systems. Nevertheless, the UK may find it convenient to use its different local infrastructures. The new Intercity Express Programme train, for example, has been specifically designed to run on British railways (Rosewell, 2017). In this respect, most of the UK’s infrastructure is owned and operated by private entities. While these entities may see it as advantageous to avoid EU standardisation practices to enhance their profits, in turn, such a choice would undoubtedly reduce connectivity with the rest of the Blue Banana region and across Europe.
5.3. Employment and welfare
The phenomena analysed above have a direct impact on the living standards of British citizens. This can be seen in the reduced availability of inexpensive imported goods produced by European companies, leading to a greater reliance on less efficient domestic firms. In addition, leaving the EU has hit the country in terms of prosperity, as measured by GDP per capita. According to Dhingra et al. (2016), the savings from lower fiscal contributions to the EU budget are outweighed by the drop in per capita income from decreased trade. As previously mentioned, the effects of the COVID-19 pandemic and the Brexit process are intertwined, thus focusing solely on the decline in one aspect would be deceptive. However, prior to the pandemic, most studies concurred that the GDP should decline by 1% to 6%. For instance, Latorre et al. (2020) modelled a welfare loss of 3.17% in 2020 in the ‘hard Brexit’ scenario, while Booth and Shankar (2018) predicted a loss of 2.2% (a similar reduction of 3.2% was predicted by Kierzenkowski et al., 2016).
The consequences for the labour market are evident: when the employment rate in the UK is higher than in the rest of the Blue Banana, the gap will narrow due to both an increase in unemployment in the European Backbone areas and a decrease in the UK regions (Table 3). Moreover, while the involved UK regions had a significantly lower share of NEETs[11] and early leavers from education[12] in the 2000–2009 period, this advantage is no longer significant as the timeframe in 2010–2019 shows (Table 3).
5.4. Attractiveness and migration
Migration was one of the main issues prompting British voters to choose against the permanence in the European Union (Burrell and Hopkins, 2019).
On top of the consequences of UK companies leaving the Blue Banana, Brexit has introduced visa fees for European citizens who want to move to the UK, leading them to no longer consider the UK as part of the common area in which the core European characteristic of free movement of people is enacted (Galpin, 2017). In this sense, the Brexit negotiation process has posed a threat to the concept of the Blue Banana itself, not only in terms of the UK’s alleged reduced competitiveness, but especially concerning the connectivity and the subsequent common sense of belonging to a European productive area.
The consequences of lower migration are negative in terms of the labour force, which is expected to experience a reduction of 2.5% by 2030 (Mathieu, 2020), thus leading to a decreased productivity rate, due to the lack of skilled workers. Moreover, even low-skilled wages are not expected to grow significantly (Portes and Forte, 2017). Therefore, the UK launched brand new visas to propel attractiveness to highly skilled individuals – the “Global Talent visa”. This scheme received a number of applications from EU countries which was below expectations (Torjesen, 2020). A more focused and restricted scheme for Nobel prizes instead received zero applications, with academics and Nobel laureates themselves sarcastically labelling such an initiative (Murugesu, 2021). Although the UK’s attention to the topic of attractiveness is to be praised, probably any new beneficial visa scheme is less favourable than the EU freedom of movement per se, both in terms of economic and social security conditions, as well as the general sense of being welcome (Marini, 2024).
Another contributing factor influencing migration patterns is the current trend of internationalised education. Delving into this matter, the UK national economy has recently placed an increasing amount of value on higher education institutions’ competitiveness. This phenomenon augments the prospects of long-term viability for the institutions, distinguishing them from those lagging behind in the competitive landscape (Labas et al., 2016).
After years of uncertainty about which status, if any, the UK would have in the future within EU funding schemes, on 7th September 2023, the UK re-entered the EU Horizon and Copernicus (but not Euratom) schemes as an Associate Country – a status already in place for non-EU members like Norway and the Swiss Confederation. Whilst this agreement ends one of the most pernicious elements of the post-Referendum period (uncertainty), and potentially restores the UK reputation, it does not give back FoM. At the same time, these first seven years of post-Referendum exacerbate the need for empirical analysis about its effects (Martini, 2024).
6. CONCLUSIONS
A full analysis of the Blue Banana concept necessitated considering recent events in both the southern and northern sections of the area, that is Brexit and Northern Italy’s declining competitiveness in the market. We attempted to project these two regions’ future roles within the European economic framework and inquired as to whether they can still be regarded as parts of Europe’s most productive core. As far as Northern Italy is concerned, we found a positive answer in terms of urbanisation and infrastructure, but both negative and positive in terms of (un)employment. Finally, the answer was negative for productivity and competitiveness, together with a short insight into the problem of pollution.
Despite the preliminary nature of our findings for London’s region, we can conclude that the UK’s new immigration and infrastructure policies pose a serious threat to the cohesion of the entire Blue Banana area, in addition to making the country less productive and competitive. Considering the pandemic’s effects on the economy, it has been demonstrated that these deficiencies have an impact on the productive centres of all participating nations.
Therefore, a more prominent role for the EU institutions, together with the coordination of its Member States in the harmonization of the competition policy, seems inevitable. First and foremost, European monies ought to support the development of infrastructure and the linkage of the Italian regions with the rest of the Blue Banana. Furthermore, the Trade and Cooperation Agreement between the United Kingdom and the European Union may strengthen regional cohesion if the competition policy is properly implemented and monitored. In this context, the restrictions of the post-Brexit immigration policy should be lifted, or at least reduced, to allow a smoother circulation of labour across the regions. In addition to the evolving contexts of the fields analysed in the present paper, ranging from urbanisation to competitiveness, future studies could examine the wage gaps in the territory under consideration, as well as the different levels of poverty and other factors that hinder the full cohesion of the area. A thorough analysis of the Blue Banana’s eastward dynamics is also necessary. These components can offer some hints about future development in the area.
Autorzy
Acknowledgements.
We thank the European Youth Think Tank cultural association for providing us with workspaces and offering us a stimulating context for the development of our collaboration on this article.
REFERENCES
ABBOTT, M. (2018), ‘Productivity: A history of its measurement’, History of Economic Thought and Policy, 1, pp. 57–80. https://doi.org/10.3280/SPE2018-001003
ACT Tuition (2024), ‘Higher Education in Europe: Trends, Challenges, and Global Competitiveness’, LinkedIn, https://www.linkedin.com/pulse/higher-education-europe-trends-challenges-global-competitiveness-7ynef [accessed on: 12.06.2024].
Airport Council International (2015), Airport Traffic Statistics.
ALEKSANDROVICH, R. B., LEVANOVICH A. S. and JOHN, S. G. (2016), ‘Air pollution and public health in a megalopolis: A case study of Moscow’, Economy of Regions, 12 (4), pp. 1069–1078. https://doi.org/10.17059/2016-4-9
ALIA, J. (1989, May 18–24), ‘C’est le grand atout de l’Europe de demain: Le trésor de la banane bleue’, Le Nouvel Observateur, pp. 74–76.
ANDERSSON, D. E., ANDERSSON, Å. E., HÅRSMANN, B. and DAGHBASHYAN, Z. (2015), ‘Unemployment in European regions: Structural problems versus the Eurozone hypothesis’, Journal of Economic Geography, 15 (5), pp. 883–905. https://doi.org/10.1093/jeg/lbu058
ANNONI, P. and DIJKSTRA, L. (2017), ‘Measuring and monitoring regional competitiveness in the European Union’, [in:] HUGGINS, R. and THOMPSON, P. (eds.), Handbook of Regions and Competitiveness: Contemporary Theories and Perspectives on Economic Development, Edward Elgar Publishing. https://doi.org/10.4337/9781783475018.00008
ANNONI, P. and DIJKSTRA, L. (2019), ‘The EU Regional Competitiveness Index 2019’, Regional and Urban Policy, Luxembourg: Office for Official Publications of the European Communities, https://www.comunidad.madrid/sites/default/files/anexo_4.5._european_regional_competitiveness_index_2019.pdf [accessed on: 24.06.2024].
BAILEY, D., DE PROPRIS, L., DE RUYTER, A., HEARNE, D. and ORTEGA-ARGILÉS, R. (2023), ‘Brexit, trade and UK advanced manufacturing sectors: A Midlands’ perspective’, Contemporary Social Science, 18 (2), pp. 250–265. https://doi.org/10.1080/21582041.2023.2192700
BECKFIELD, J. (2019), Unequal Europe: Regional Integration and the Rise of European Inequality, Oxford: Oxford University Press. https://doi.org/10.1093/oso/9780190494254.001.0001
BERGEAUD, A., CETTE, G. and LECAT, R. (2016), ‘Productivity Trends in Advanced Countries between 1890 and 2012’, Review of Income and Wealth, 62, pp. 420–444. https://doi.org/10.1111/roiw.12185
BERTAMINO, F., BRONZINI, R., DE MAGGIO, M. and REVELLI, D. (2016), ‘Local policies for innovation: The case of technology districts in Italy’, Bank of Italy and the Eurosystem Occasional Papers, 313. https://doi.org/10.2139/ssrn.2765402
BEYER, R. C. M. and STEMMER, M. A. (2016), ‘Polarization or convergence? An analysis of regional unemployment disparities in Europe over time’, Economic Modelling, 55, pp. 373–381. https://doi.org/10.1016/j.econmod.2016.02.027
BLOOM, N., BUNN, P., CHEN, S., MIZEN, P., SMIETANKA, P. and THWAITES, G. (2019), ‘The impact of Brexit on UK firms’, NBER Working Paper No. 26218. https://doi.org/10.3386/w26218
BONASIA, M. and NAPOLITANO, O. (2012), ‘Determinants of interregional migration flows: the role of environmental factors in the Italian case’, The Manchester School, 80 (4), pp. 525–544. https://doi.org/10.1111/j.1467-9957.2012.02300.x
BOOTH, S. and SHANKAR, A. (2018), ‘No deal: The economic consequences and how they could be mitigated’, Open Europe, https://www.consilium.europa.eu/media/37227/ttr_2018_61.pdf [accessed on: 24.06.2024].
BOREL-SALADIN, J. M. and TUROK, I. N. (2013), ‘The green economy: incremental change or transformation?’, Environmental Policy and Governance, 23 (4), pp. 209–220. https://doi.org/10.1002/eet.1614
BOSCHMA, R. A. (2004), ‘Competitiveness of regions from an evolutionary perspective’, Regional Studies, 38 (9), pp. 1001–1014. https://doi.org/10.1080/0034340042000292601
BRISTOW, G. (2010), Critical reflections on regional competitiveness: Theory, policy, practice, London: Routledge. https://doi.org/10.4324/9780203865408
BRUNET, R. and BOYER, J. C. (1989), ‘Les villes ‟européennes”: Rapport pour la DATAR’, Délégation à l’aménagement du territoire et à l’action régionale, Paris: La Documentation française.
BUKOWSKI, P., CHROSTEK, P., NOVOKMET, F. and SKAWIŃSKI, M. (2023), ‘Income inequality in the 21st century Poland’, Ministry of Finance, Republic of Poland, https://www.gov.pl/web/finance/no-40-2023-p-bukowski-p-chrostek-f-novokmet-m-skawinski-income-inequality-in-the-21st-century-poland [accessed on: 21.06.2024].
BULL, M. J. (2018), ‘In the eye of the storm: The Italian economy and the Eurozone crisis’, South European Society and Politics, 23 (1), pp. 13–28. https://doi.org/10.1080/13608746.2018.1433477
BURRELL, K. and HOPKINS, P. (2020), ‘Introduction: Brexit, race, and migration’, Environment and Planning C: Politics and Space, 37 (1), pp. 4–7. https://doi.org/10.1177/0263774X18811923a
BYRNE, S. and RICE, J. (2018), ‘Non-tariff barriers and goods trade: A Brexit impact analysis’, Research Technical Paper, Central Bank of Ireland, 2018 (7), pp. 1–29, https://ideas.repec.org/p/cbi/wpaper/6-rt-18.html [accessed on: 17.06.2024].
CALCAGNINI, G. and TRAVAGLINI, G. (2014), ‘A time series analysis of labor productivity. Italy versus the European countries and the U.S.’, Economic Modelling, 36, pp. 622–628. https://doi.org/10.1016/j.econmod.2013.02.020
CELLINI, R. and SOCI, A. (2002), ‘Pop competitiveness’, Banca Nazionale del Lavoro Quarterly Review, 55 (220), pp. 71–101. https://doi.org/10.13133/2037-3643/9905
CERMAKOVA, K., JANKOVIĆ, V., KADEŘÁBKOVÁ, B. and MITWALLYOVA, H. (2015), ‘The impact of investments into the railway infrastructure in European economics’, European Transports, issue 58, paper no. 6, https://www.researchgate.net/publication/284919796_The_impact_of_investments_into_the_railway_infrastructure_in_the_European_economics [accessed on: 19.06.2024].
CLARK, C. (1940), The conditions of economic progress, London: Macmillan.
CLARK, G., MOONEN, T. and NUNLEY, J. (2019), ‘The story of your city, Europe and its urban development, 1970 to 2020’, City, Transformed, European Investment Bank. https://doi.org/10.2867/460398
COUTTS, K., BUCHANAN, J. and GUDGIN, G. (2018), ‘How the economics profession got it wrong on Brexit’, Centre for Business Research, University of Cambridge, Working Paper No. 493. https://doi.org/10.1007/978-3-030-18103-1_13
CSOMÓS, G. and TÓTH, G. (2016), ‘Mapping the position of cities in corporate research and development through a gravity model-based bidimensional regression analysis’, Regional Statistics, 6 (1), pp. 217–220. https://doi.org/10.15196/RS06111
DE GRAUWE, P. (2007), Economics of monetary union, Oxford: Oxford University Press.
DE NONI, I., GANZAROLI, A. and ORSI, L. (2017), ‘The impact of intra-and inter-regional knowledge collaboration and technological variety on the knowledge productivity of European regions’, Technological Forecasting and Social Change, 117, pp. 108–118. https://doi.org/10.1016/j.techfore.2017.01.003
DHINGRA, S., OTTAVIANO, G. I. P., SAMPSON, T. and VAN REENEN, J. (2016), ‘The consequences of Brexit for UK trade and living standards’, LSE Research Online Documents on Economics, Centre for Economic Performance, Paper Brexit 02, https://eprints.lse.ac.uk/66144/ [accessed on: 28.06.2024].
DIEMER, A., IAMMARINO, S., RODRÍGUEZ-POSE, A. and STORPER, M. (2022), ‘The Regional Development Trap in Europe’, Economic Geography, 98 (5), pp. 487–509. https://doi.org/10.1080/00130095.2022.2080655
DUNFORD, M. (1994), ‘Winners and losers: The new map of economic inequality in the European Union’, European Urban and Regional Studies, 1 (2), pp. 95–114. https://doi.org/10.1177/096977649400100201
EUROPEAN COMMISSION (2017), ‘Recommendation for a council recommendation on the 2017 national reform programme of Italy and delivering a council opinion on the 2017 stability programme of Italy’, https://eur-lex.europa.eu/legal-content/EN/TXT/?uri=CELEX%3A52017DC0511 [accessed on: 7.06.2024].
FAINI, R. (2003), ‘Fu vero declino? L’Italia degli anni Novanta’, Il Mulino, Rivista trimestrale di cultura e di politica, 6, pp. 1072–1083. https://doi.org/10.1402/10504
FALUDI, A. K. F. (2015), ‘The blue banana revisited’, European Journal of Spatial Development, 13 (1), pp. 1–26. https://doi.org/10.5281/zenodo.5141230
FISHER, A. G. B. (1939), ‘Production, primary, secondary and tertiary’, Economic Record, 15 (1), pp. 24–38. https://doi.org/10.1111/j.1475-4932.1939.tb01015.x
FLORIDA, R. (2017), The new urban crisis: How our cities are increasing inequality, deepening segregation, and failing the middle class – and what we can do about it, New York: Basic Books.
FLORIDA, R. and TINAGLI, I. (2004), ‘Europe in the Creative Age’, Software: Industry Center.
FONDAZIONE PIRELLI (2021), ‘Italy’s Educational Poverty (13 Million Poorly-Educated People) and the Decisions that Need to be Made to Channel the Recovery Fund into Schooling’, https://www.fondazionepirelli.org/en/corporate-culture/blog/italys-educational-poverty/ [accessed on: 11.06.2024].
FUSS, C. and VERMEULEN, P. (2008), ‘Firms’ investment decisions in response to demand and price uncertainty’, Applied Economics, 40 (18), pp. 2337–2351. https://doi.org/10.1080/00036840600959909
GALPIN, C. (2017), The Euro Crisis and European Identities: Political and Media Discourse in Germany, Ireland, Poland, London: Palgrave Macmillan.
GERMANI, A. R., SCARAMOZZINO, P., CASTALDO, A., and TALAMO, G. (2021), ‘Does air pollution influence internal migration? An empirical investigation on Italian provinces’, Environmental Science & Policy, 120, pp. 11–20. https://doi.org/10.1016/j.envsci.2021.02.005
HOSPERS, G. J. (2002), ‘Industrial heritage tourism and regional restructuring in the European Union’, European Planning Studies, 10 (3), pp. 397–404. https://doi.org/10.1080/09654310220121112
HOSPERS, G. J. (2003), ‘Beyond the Blue Banana? Structural change in Europe’s geo-economy’, Intereconomics, 38 (2), pp. 76–85. https://doi.org/10.1007/BF03031774
HUDSON, R. (2003), ‘European integration and new forms of uneven development: But not the end of territorially distinctive capitalisms in Europe’, European Urban and Regional Studies, 10 (1), pp. 49–67. https://doi.org/10.1177/a032539
HUTTON, G. (2024), ‘Business Statistics’, Commons Library Research Briefing, https://researchbriefings.files.parliament.uk/documents/SN06152/SN06152.pdf [accessed on: 16.06.2024].
JACOBS, J. (1969), The Economy of Cities, London: Vintage.
JUNARSIN, E. (2009), ‘Creativity and Competitiveness’, Globalization, https://globalization.icaap.org/content/v8.1/Junarsin.pdf [accessed on: 8.06.2024].
JURIC, T. (2021), ‘Gamechanger in EU demography: Working-from-home economy’, SSRN Electronic Journal. https://doi.org/10.2139/ssrn.3939382
KAZIMIERCZAK, J. (2014), ‘Revitalization and ITS Impact on Public. Space Organization. A Case Study of Manchester in UK, Lyon in France and Łódź in Poland’, TeMA – Journal of Land Use, Mobility and Environment, https://www.researchgate.net/publication/307776738_Revitalization_and_ITS_Impact_on_Public_Space_Organization_A_Case_Study_of_Manchester_in_UK_Lyon_in_France_and_Lodz_in_Poland [accessed on: 10.06.2024].
KIERZENKOWSKI, R., PAIN, N., RUSTICELLI, E. and ZWART, S. (2016), ‘The economic consequences of Brexit: A taxing decision’, OECD Economic Policy Papers, 16, pp. 1–36. https://doi.org/10.1787/5jm0lsvdkf6k-en
KLASEN, S. and NESTMANN, T. (2006), ‘Population, population density and technological change’, Journal of Population Economics, 19, pp. 611–626. https://doi.org/10.1007/s00148-005-0031-1
KOCZISZKY, G., DÁVID, L., GEZA, T. and NAGY, Z. (2015), ‘New method for analysing the spatial structure of Europe’, Economic computation and economic cybernetics studies and research, 49 (3), pp. 143–160, https://www.researchgate.net/publication/282121977_New_method_for_analysing_the_spatial_structure_of_Europe [accessed on: 21.06.2024].
KRUGMAN, P. (1994), ‘Competitiveness: A dangerous obsession’, Foreign Affairs, 73 (2), pp. 28–44. https://doi.org/10.2307/20045917
KRUGMAN, P., MELITZ, M. and OBSTFELD, M. (2009), International Economics: Theory and Policy, Boston: Pearson Addison-Wesley.
KUNZMANN, K. R. (2007), ‘Euro‐megalopolis or theme park Europe? Scenarios for European spatial development’, International Planning Studies, 1 (2), pp. 143–163. https://doi.org/10.1080/13563479608721649
KUNZMANN, K. R. and WEGENER, M. (1991), ‘The pattern of urbanisation in Western Europe’, 1960–1990, Ekistics, 58 (350/351), pp. 282–291, https://www.jstor.org/stable/43646772 [accessed on: 7.06.2024].
LABAS, I., DARABOS, E. and NAGY, T. O. (2016), ‘Competitiveness – Higher Education’, Studia Universitatis Economics Series. https://doi.org/10.1515/sues-2016-0002
LAKÓCAI, C. (2022), ‘Unequal Europe: Regional integration and the rise of European inequality by Jason Beckfield’, International Journal of Euro-Mediterranean Studies, 15 (1), pp. 137–140, https://www.researchgate.net/publication/361664054_Unequal_Europe_Regional_Integration_and_the_Rise_of_European_Inequality_by_Jason_Beckfield_-_book_review [accessed on: 22.06.2024].
LATORRE, M. C., OLEKSEYUK, Z. and YONEZAWA, H. (2020), ‘Trade and foreign direct investment‐related impacts of Brexit’, The World Economy, 43 (1), pp. 2–32. https://doi.org/10.1111/twec.12859
LORIAUX, M. M. (2008), European Union and the Deconstruction of the Rhineland Frontier, Cambridge: Cambridge University Press. https://doi.org/10.1017/CBO9780511720550
LOTTI, F. and SANTARELLI, E. (2001), ‘Linking knowledge to productivity: A Germany-Italy comparison using the CIS database’, Empirica, pp. 293–317. https://doi.org/10.1023/A:1011871306878
LUPI, M., PRATELLI, A., GIACHETTI, A., & FARINA, A. (2018), ‘Il trasporto ferroviario in Italia: una analisi dei collegamenti ferroviari di trasporto combinato – Rail freight transport in Italy: an analysis of combined transport connections’. Ingegneria Ferroviaria, 53 (3), 209245.
MARINI, G. (2024), ‘Brexit and the War for Talents: Push & pull evidence about competitiveness’, Higher Education. https://doi.org/10.1007/s10734-024-01186-1
MARINO, F. and NUNZIATA, L. (2017), ‘The labor market in Italy, 2000–2016’, IZA World of Labor, Institute of Labor Economics (IZA), https://wol.iza.org/uploads/articles/407/pdfs/the-labor-market-in-italy.pdf?v=1 [accessed on: 19.06.2024].
MARIOTTI, I. (2017), ‘The attractiveness of Milan and the spatial patterns of international firms’, [in:] ARMONDI, S. and DI VITA, S. (eds.), Milan: productions, spatial patterns and urban change, London: Routledge. https://doi.org/10.4324/9781315269450-4
MATHIEU, C. (2020), ‘Brexit: What economic impacts does the literature anticipate?’, Revue de l’OFCE, 167 (3), pp. 43–81. https://doi.org/10.3917/reof.167.0043
MATTHIJS, M. and MCNAMARA, K. (2015), ‘The Euro Crisis’ theory effect: Northern saints, southern sinners, and the demise of the Eurobond’, Journal of European Integration, 37 (2), pp. 229–245. https://doi.org/10.1080/07036337.2014.990137
MEYER-STAMLER, J. (2008), Systemic competitiveness and local economic development, Duisberg, Germany: Meso Partner.
MICHAELS, E., HANDFIELD-JONES, H. and AXELROD, B. (2001), The war for talent, Harvard Business Press.
MOSCHELLA, M. (2017), ‘Italy and the fiscal compact: Why does a country commit to permanent austerity?’, Rivista Italiana di Scienza Politica, 47 (02), pp. 205–225. https://doi.org/10.1017/ipo.2017.7
MURUGESU, A. M. (2021), UK visa scheme for prize-winning scientists receives no applications. NewScientist. Prestigious prize visa: UK Global Talent fast-track scheme for scientists hasn’t received any applications since it launched | New Scientist [accessed on: 21.09.2023].
MUSOLINO, D. and KOTOSZ, B. (2024), ‘A new territorial attractiveness index at the international scale: design, application and patterns in Italy’, The Annals of Regional Science, 72, pp. 1159–1187. https://doi.org/10.1007/s00168-023-01239-w
NAGY, Z. and TÓTH, G. (2016), ‘The world’s economic centre of gravity’, Regional Statistics, 6 (2), pp. 177–180. https://doi.org/10.15196/RS06210
NAGY, Z. and TÓTH, G. (2019), ‘The effect of large companies on spatial structure in Central and Eastern Europe with a particular focus on enterprises in the technology, media & telecommunications industry’, Club of Economics in Miskolc’ TMP, 15 (2), pp. 41–51. https://doi.org/10.18096/TMP.2019.02.05
NAUDÉ, W., SURDEJ, A. and CAMERON, M. (2019), ‘The past and future of manufacturing in Central and Eastern Europe: Ready for Industry 4.0?’, IZA Discussion Paper, 12141. https://doi.org/10.2139/ssrn.3390128
NIJKAMP, P. (1993), ‘Towards a network of regions: The United States of Europe’, European Planning Studies, 1 (2), pp. 149–168. https://doi.org/10.1080/09654319308720206
NOVOKMET, F. (2018), ‘The long-run evolution of inequality in the Czech Lands, 1898–2015’, World Inequality database, the global datasource, Working Paper series N° 2018/06, http://wid.world/wp-content/uploads/2018/03/WID_WORKING_PAPER_2018_6_Novokmet_Czech_Republic.pdf [accessed on: 24.06.2024].
NOVOKMET, F., NIKOLIĆ, N. and LARYSZ, P. P. (2024), ‘Income Inequality in Eastern Europe: Bulgaria and Czechoslovakia in the Twentieth Century’, World Inequality Lab, Working Paper n. 2024/12, https://wid.world/wp-content/uploads/2024/04/WorldInequalityLab_WP2024_12_Income-Inequality-in-Eastern-Europe-Bulgaria-and-Czechoslovakia-in-the-twentieth-century_Final.pdf [accessed on: 21.06.2024].
OECD (2019), PISA 2018 Results (Volume I): What Students Know and Can Do, Paris: OECD Publishing.
OPENSHAW, S. and TAYLOR, P. J. (1979), ‘A million or so correlation coefficients: Three experiments on the modifiable areal unit problem’, [in:] WRIGLEY, N. (ed.), Statistical Applications in the Spatial Sciences, London: Pion.
OTTAVIANO, G. I. P., PESSOA, J. P., SAMPSON, T. and VAN REENEN, J. (2014), ‘Brexit or fixit? The trade and welfare effects of leaving the European Union’, CEP Policy Analysis (CEPPA016), The London School of Economics and Political Science, Center of Economic Performance, https://eprints.lse.ac.uk/57958/ [accessed on: 17.06.2024].
PASTORI, E., TAGLIAVIA, M., TOSTI, E. and ZAPPA, S. (2014), ‘L’indagine sui costi del trasporto internazionale delle merci in Italia: Metodi e risultati’, Rivista di economia e politica dei trasporti, 3 (2), pp. 1–61, https://www.openstarts.units.it/entities/publication/01837f7c-eeb2-461d-9109-3eb03ce8e0aa/details [accessed on: 2.06.2024].
PERROUX, F. (1950), ‘Economic space: Theory and applications’, The Quarterly Journal of Economics, 64 (1), pp. 89–104. https://doi.org/10.2307/1881960
PETRINI, F. (2011), ‘La fine dell’oro (nero). Le grandi compagnie e la prima crisi energetica’, CONTEMPORANEA, 3, pp. 445–471, https://www.academia.edu/1551094/L [accessed on: 4.06.2024].
PINELLI, D., ARPAIA, A., CASSIO, L., PACE, L. and TORRE, R. (2017), ‘The recent reform of the labour market in Italy: A review’, European Economy – Discussion Papers 2015 – 072. Directorate-General for Economic and Financial Affairs (DG ECFIN), European Commission. https://doi.org/10.2765/049593
PORTER, M. E., SALA-I-MARTIN, X. and SCHWAB, K. (2007), ‘The Global Competitiveness Report 2007–2008’, World Economic Forum.
PORTES, J. and FORTE, G. (2017), ‘The economic impact of Brexit-induced reductions in migration’, Oxford Review of Economic Policy, 33 (1), pp. 31–44. https://doi.org/10.1093/oxrep/grx008
PUGA, D. (2002), ‘European regional policies in light of recent location theories’, Journal of Economic Geography, 2 (4), pp. 373–406. https://doi.org/10.1093/jeg/2.4.373
RÖLLER, L. H. and WAVERMAN, L. (2001), ‘Telecommunications infrastructure and economic development: A simultaneous approach’, American Economic Review, 91 (4), pp. 909–923. https://doi.org/10.1257/aer.91.4.909
ROSEWELL, B. (2017), ‘Infrastructure, policy, and Brexit’, Oxford Review of Economic Policy, 33 (1), pp. 113–123. https://doi.org/10.1093/oxrep/grx016
SALAMONE, L. (2024), ‘Is Milano’s polluted air a political issue now? Between petitions, contradictions and very uncomfortable questions’, NSS Magazine, https://www.nssmag.com/en/fashion/35850/milano-smog-petizione [accessed on: 16.06.2024].
SALTARI, E. and TRAVAGLINI, G. (2008), ‘Il rallentamento della produttività del lavoro e la crescita dell’occupazione. Il ruolo del progresso tecnologico e della flessibilità del lavoro’, Rivista Italiana degli Economisti, 1, pp. 1–38, https://www.researchgate.net/publication/46532828_Il_rallentamento_della_produttivita’_del_lavoro_e_la_crescita_dell’occupazione_Il_ruolo_del_progresso_tecnologico_e_della_flessibilita’_del_lavoro [accessed on: 17.06.2024].
SANTAMARÍA, M., VENTURA, J. and YEŞILBAYRAKTAR, U. (2023), ‘Exploring European regional trade’, Journal of International Economics, 146, 103747. https://doi.org/10.1016/j.jinteco.2023.103747
SCAMUZZI, S. (2022), ‘Deindustrialization in Turin and the role of local government for economic and urban change’, Deindustrialisation in Twentieth-Century Europe: The Northwest of Italy and the Ruhr Region in Comparison, Cham: Springer International Publishing, pp. 287–311. https://doi.org/10.1007/978-3-030-89631-7_12
SCHADE, W., MADER, S. and ROTHENGATTER, W. (2016), ‘Connectivity and accessibility of transport infrastructure in Central and Eastern European EU member states’, Directorate-General for Internal Policies of the Union – Policy Department B: Structural and Cohesion Policies / Transport and Tourism, https://www.researchgate.net/publication/303288768_Connectivity_and_Accessibility_of_Transport_Infrastructure_in_Central_and_Eastern_European_EU_Member_States [accessed on: 19.06.2024].
SCHNYDER, G. (2022), ‘Sewage, Immigration, and Charter Cities: Brexit’s multifarious impacts and mundane purpose’, Brexit Impact Tracker.
SCHWAB, K. (2012), ‘The global competitiveness report 2012–2013’, World Economic Forum, https://www3.weforum.org/docs/WEF_GlobalCompetitivenessReport_2012-13.pdf [accessed on: 19.06.2024].
SEDLÁČEK, P., SCHULARICK, M. and BORN, B. (2019), ‘£350 million a week: The output cost of the Brexit vote’, VoxEU, https://cepr.org/voxeu/columns/ps350-million-week-output-cost-brexit-vote [accessed on: 14.06.2024].
SGHERRI, S. (2005), ‘Long-run productivity shifts and cyclical fluctuations: Evidence for Italy’, IMF Working Paper, No. 05/228. https://doi.org/10.5089/9781451862478.001
STERLACCHINI, A. and VENTURINI, F. (2014), ‘R&D and productivity in high-tech manufacturing: A comparison between Italy and Spain’, Industry and Innovation, 21, pp. 359379. https://doi.org/10.1080/13662716.2014.959315
TAYLOR, P. and HOYLER, M. (2000), ‘The spatial order of European cities conditions of contemporary globalisation’, Tijdschrift voor Economische en Sociale Geografie, 91, pp. 176–189. https://doi.org/10.1111/1467-9663.00104
THERBORN, G. (1995), ‘European modernity and beyond: The trajectory of European societies 1945–2000’, SAGE Publications Ltd. https://doi.org/10.4135/9781446222317
TORJESEN, I. (2020), ‘UK offers fast track visas to top researchers and scientists’, BMJ: British Madical Journal (Online), 368, m342.
TRALDI, L. (2017), ‘Richard Florida: on cities, prosperity and inequality’, DesignAtLarge, https://www.designatlarge.it/richard-florida-urban-crisis-cities/?lang=en [accessed on: 16.06.2024].
TRIFKOVIĆ, M., KUBURIĆ, M., NESTOROVIĆ, Ž., JOVANOVIĆ, G. and KEKANOVIĆ, M. (2021), ‘The Attractiveness of Urban Complexes: Economic Aspect and Risks of Environmental Pollution. Sustainability’, 13 (14), 8098. https://doi.org/10.3390/su13148098
TUROK, I. (2004), ‘Cities, regions and competitiveness’, Regional Studies, 38 (9), pp. 1069–1083. https://doi.org/10.1080/0034340042000292647
VAN DER MEER, L. (1998), ‘Red octopus’, [in:] BLAAS, W. (ed.), A new perspective for European spatial development policies, London: Routledge.
VAN WEE, B., ANNEMA, J. A. and BANISTER, D. (2013), ‘The transport system and transport policy: An introduction’, Edward Elgar Publishing, Inc.
YOUNG, J. T. (1898), ‘Administrative centralization and decentralization in France’, The Annals of the American Academy of Political and Social Science, 11 (1), pp. 24–43. https://doi.org/10.1177/000271629801100102
ZAWIEJA-ŻUROWSKA, K. and ZIMNY, A. (2015), ‘“Blue Banana” or Central and Eastern Europe? The development of European logistics hubs’, Journal of Economic and Business Science, Novo Mesto, 1, pp. 97–111, https://depot.ceon.pl/handle/123456789/13667 [accessed on: 4.06.2024].
APPENDIX
| 2000–2009 | Mean (not in Blue Banana) |
Std. Dev. | Mean (in Blue Banana) |
Std. Dev. | Difference in Means | Std. Error | Unit |
|---|---|---|---|---|---|---|---|
| Labour market | no data | no data | no data | no data | no data | no data | no data |
| Employment rate | 64.63 | 8.29 | 68.23 | 5.37 | 3.60*** | 0.02 | % |
| NEET rates | 13.75 | 6.74 | 10.95 | 2.84 | -2.80*** | 0.01 | % |
| Early leavers from education | 17.11 | 10.45 | 15.46 | 4.73 | -1.65*** | 0.02 | % |
| Innovation | no data | no data | no data | no data | no data | no data | no data |
| GERD | 165.55 | 268.66 | 250.92 | 327.87 | 85.38*** | 1.33 | no data |
| Patent applications | 88.09 | 112.63 | 205.02 | 138.59 | 116.93*** | 0.55 | Number/mn inhabitants |
| High-tech patent applications | 18.98 | 36.84 | 33.14 | 26.54 | 14.16*** | 0.11 | Number/mn inhabitants |
| EUTM applications | 95.14 | 143.99 | 132.44 | 58.27 | 37.29*** | 0.29 | Number/mn inhabitants |
| Productivity | no data | no data | no data | no data | no data | no data | no data |
| Gross VA at basic prices | 102,630.71 | 337,408.25 | 110,481.23 | 124,375.98 | 7,850.52*** | 663.48 | no data |
| Employment in technology and knowledge-intensive | 16.27 | 21.85 | 16.66 | 21.60 | 0.39*** | 0.08 | % of total employment |
| HRST | 1,000.56 | 3,290.50 | 757.88 | 905.23 | -242.68*** | 4.99 | % of total population |
| Gross fixed capital formation | 1,000.56 | 3,290.50 | 757.88 | 905.23 | -242.68 | 4.99 | no data |
| Compensation of employees | 54,675.82 | 180,899.66 | 57,539.74 | 66,541.84 | 2,863.92*** | 358.13 | no data |
| Competitiveness-enhancing characteristics | no data | no data | no data | no data | no data | no data | no data |
| Manufacturing firms | 24,525.24 | 57,114.95 | 13,148.51 | 26,313.08 | -11,376.73*** | 147.83 | Number |
| Population density | 360.20 | 842.92 | 323.93 | 232.57 | -36.27*** | 1.28 | Inhabitants/km2 |
| Motorways | 722.54 | 1,623.35 | 678.16 | 696.49 | -44.38*** | 3.92 | km |
| Railways | 2,792.24 | 5,193.99 | 1,469.63 | 1,087.02 | -1,422.62*** | 9.70 | km |
| 2010–2019 | Mean (not in Blue Banana) | Std. Dev. | Mean (in Blue Banana) | Std. Dev. | Difference in Means | Std. Error | Unit |
|---|---|---|---|---|---|---|---|
| Labour market | no data | no data | no data | no data | no data | no data | no data |
| Employment rate | 64.50 | 5.51 | 70.48 | 9.79 | 5.98 | 0.00 | % |
| NEETs rates | 15.90 | 4.01 | 12.07 | 8.09 | -3.84 | 0.00 | % |
| Early leavers from education | 13.74 | 3.10 | 11.18 | 9.86 | -2.56 | 0.00 | % |
| Innovation | no data | no data | no data | no data | no data | no data | no data |
| GEERD | 288.40 | 203.45 | 541.12 | 249.86 | 252.72 | 0.00 | no data |
| Patent applications | 178.14 | 224.70 | 376.44 | 192.92 | 198.30 | 0.00 | Number/mn inhabitants |
| High-tech patent applications | 34.38 | 35.03 | 48.65 | 48.51 | 14.28 | 0.00 | Number/mn inhabitants |
| EUTM applications | 128.49 | 72.25 | 193.63 | 125.20 | 65.15 | 0.00 | Number/mn inhabitants |
| Productivity | no data | no data | no data | no data | no data | no data | no data |
| Enterprise birth rates | 10.38 | 1.84 | 7.33 | 3.01 | -3.05 | 0.00 | See Notes |
| Gross VA at basic prices | 84,352.36 | 155,379.72 | 110,403.05 | 187,434.57 | 26,050.69 | 0.04 | no data |
| Employment in technology and knowledge-intensive | 3.48 | 1.08 | 2.99 | 1.81 | -0.49 | 0.00 | % of total employment |
| Gross fixed capital formation | 19,553.99 | 34,457.52 | 24,525.79 | 43,397.40 | 4,971.79 | 0.08 | no data |
| Compensation of employees | 43,567.58 | 81,152.66 | 55,418.73 | 99,595.28 | 11,851.15 | 0.08 | no data |
| Competitiveness-enhancing characteristics | no data | no data | no data | no data | no data | no data | no data |
| Manufacturing firms | 573.63 | 75.03 | 730.30 | 361.69 | 156.67 | 0.00 | Number |
| Population density | 163.35 | 180.83 | 300.91 | 167.06 | 137.56 | 0.00 | Inhabitants/km2 |
| Motorways | 12,050.73 | 57,796.91 | 18,960.46 | 24,678.87 | 6,909.73 | 0.00 | km |
| Railways | 1,174.27 | 3,689.17 | 2,036.06 | 752.47 | 861.79 | 0.00 | km |
Source: our work from Eurostat database.
| 2000–2009 | Mean (in B.B. except Italy) | Std. Dev. | Mean (North Italy) | Std. Dev. | Diff. in Means | Std. Error | Unit |
|---|---|---|---|---|---|---|---|
| Labour market | no data | no data | no data | no data | no data | no data | no data |
| Employment rate | 69.45 | 5.55 | 65.01 | 3.12 | -4.44*** | 0.03 | % |
| NEET rates | 10.97 | 3.06 | 10.88 | 2.15 | -0.10*** | 0.02 | % |
| Early leavers from education | 14.08 | 3.35 | 19.24 | 5.78 | 5.16*** | 0.04 | % |
| Innovation | no data | no data | no data | no data | no data | no data | no data |
| GERD | 303.24 | 368.60 | 125.52 | 131.22 | -177.72*** | 1.96 | no data |
| Patent applications | 242.65 | 144.93 | 108.95 | 42.17 | -133.70*** | 0.72 | Number/mn inhabitants |
| High-tech patent applications | 41.57 | 26.42 | 11.61 | 8.67 | -29.96*** | 0.13 | Number/mn inhabits |
| EUTM applications | 136.09 | 57.47 | 123.12 | 59.23 | -12.97*** | 0.50 | Number/mn inhabitants |
| Productivity | no data | no data | no data | no data | no data | no data | no data |
| Gross VA at basic prices | 126,358.85 | 138,456.14 | 81,493.30 | 86,098.25 | -44,865.56*** | 914.39 | no data |
| Employment in technology and knowledge-intensive | 16.65 | 21.66 | 16.68 | 21.43 | 0.04 | 0.18 | % of total employment |
| HRST | 865.51 | 998.53 | 474.53 | 490.98 | -390.98*** | 5.38 | % of total population |
| Gross fixed capital formation | 865.51 | 998.53 | 474.53 | 490.98 | -390.98*** | 5.38 | no data |
| Compensation of employees | 70,470.00 | 75,237.44 | 33,932.82 | 36,256.99 | -36,537.18*** | 453.96 | no data |
| Competitiveness-enhancing characteristics | no data | no data | no data | no data | no data | no data | no data |
| Manufacturing firms | 6,522.09 | 11,913.60 | 45,634.90 | 46,049.11 | 39,112.81*** | 511.36 | Number |
| Population density | 374.57 | 245.40 | 190.58 | 115.81 | -183.99*** | 1.30 | Inhabitants/km2 |
| Motorways | 2,421.09 | 850.68 | 414.06 | 223.16 | -465.86*** | 5.63 | km |
| Railways | 2,421.09 | 991.68 | 868.88 | 611.75 | -1,552.22*** | 9.91 | km |
| 2010–2019 | Mean (in B.B. except Italy) | Std. Dev. | Mean (North Italy) | Std. Dev. | Diff. in Means | Std. Error | Unit |
|---|---|---|---|---|---|---|---|
| Labour market | no data | no data | no data | no data | no data | no data | no data |
| Employment rate | 68.61 | 6.42 | 66.10 | 2.88 | -2.51*** | 0.30 | % |
| NEET rates | 12.57 | 4.10 | 16.09 | 3.63 | 2.01*** | 0.23 | % |
| Early leavers from education | 10.83 | 2.79 | 12.85 | 3.63 | 2.01*** | 0.23 | % |
| Innovation | no data | no data | no data | no data | no data | no data | no data |
| GERD | 680.70 | 151.18 | 407.28 | 134.95 | -273.42*** | 25.01 | no data |
| Patent applications | 212.97 | 125.03 | 109.66 | 45.85 | -103.31*** | 13.90 | Number/mn inhabitants |
| High-tech patent applications | 30.37 | 16.61 | 9.76 | 5.12 | -20.61*** | 1.82 | Number/mn inhabitants |
| EUTM applications | 202.17 | 67.00 | 168.20 | 64.57 | -33.97 | 9.32 | Number/mn inhabitants |
| Productivity | no data | no data | no data | no data | no data | no data | no data |
| Enterprise birth rates | 9.65 | 0.89 | 6.10 | 0.60 | -3.56*** | 0.08 | See Notes |
| Gross VA at basic prices | 133,107.93 | 204,553.18 | 92,743.70 | 97,665.32 | -40,364.23*** | 13,263.92 | no data |
| Employment in technology and knowledge-intensive | 2.80 | 1.25 | 3.16 | 0.87 | 0.36*** | 0.09 | % of total employment |
| HRST | 19.82 | 3.51 | 18.37 | 1.52 | -1.45*** | 0.22 | % of total population |
| Gross fixed capital formation | 31,143.44 | 46,330.33 | 19,378.72 | 19,353.27 | -11,764.72*** | 2,950.67 | no data |
| Compensation of employees | 74,197.06 | 109,488.81 | 40,813.35 | 43,149.49 | -33,383.71*** | 6,927.15 | no data |
| Competitiveness-enhancing characteristics | no data | no data | no data | no data | no data | no data | no data |
| Population density | 218.46 | 154.89 | 192.40 | 118.22 | -26.06* | 10.67 | Inhabitants/km2 |
| Motorways | 21,351.24 | 33,916.34 | 5,144.32 | 6,521.63 | -16,206.92*** | 1,995.51 | km |
| Railways | 1,557.11 | 727.20 | 936.79 | 631.93 | -620.33*** | 55.77 | km |
| 2000–2009 | Mean (in B. B. except UK) | Std. Dev. | Mean (UK) | Std. Dev. | Diff. in Means | Std. Error | Unit |
|---|---|---|---|---|---|---|---|
| Labour Market | no data | no data | no data | no data | no data | no data | no data |
| Employment rate | 66.17 | 4.14 | 75.44 | 1.81 | 9.27*** | 0.02 | % |
| NEET rates | 11.32 | 2.85 | 9.64 | 2.37 | -1.68*** | 0.02 | % |
| Early leavers from education | 15.80 | 4.75 | 14.38 | 4.48 | -1.42*** | 0.04 | % |
| Innovation | no data | no data | no data | no data | no data | no data | no data |
| GERD | 197.89 | 267.96 | 429.98 | 431.79 | 232.09*** | 3.74 | no data |
| Patent applications | 221.66 | 153.30 | 156.05 | 58.01 | -65.61*** | 0.81 | Number/mn inhabitants |
| High-tech patent applications | 28.83 | 24.64 | 45.82 | 27.84 | 16.99*** | 0.24 | Number/mn inhabitants |
| EUTM applications | 134.78 | 59.44 | 125.53 | 54.09 | -9.25*** | 0.49 | Number/mn inhabitants |
| Productivity | no data | no data | no data | no data | no data | no data | no data |
| Employment in technology and knowledge-intensive | 16.61 | 21.31 | 16.84 | 22.57 | 0.24 | 0.20 | % of total employment |
| HRST | 847.52 | 1,006.20 | 443.63 | 126.18 | -403.89*** | 4.20 | % of total population |
| Competitiveness-enhancing characteristics | no data | no data | no data | no data | no data | no data | no data |
| Manufacturing firms | 16,437.36 | 31,043.35 | 5,735.03 | 1,218.84 | -10,702.33*** | 169.63 | Number |
| Population density | 292.77 | 189.48 | 432.94 | 320.07 | 140.17*** | 2.55 | Inhabitants/km2 |
| 2010–2019 | Mean (in B-B. except UK) | Std. Dev. | Mean (UK) | Std. Dev. | Diff. in Means | Std. Error | Unit |
|---|---|---|---|---|---|---|---|
| Labour market | no data | no data | no data | no data | no data | no data | no data |
| Employment rate | 68.99 | 5.25 | 73.53 | 2.99 | 4.54*** | 0.18 | % |
| NEET rates | 12.19 | 4.14 | 12.22 | 2.42 | 0.04 | 0.14 | % |
| Early leavers from education | 12.38 | 3.54 | 12.52 | 4.03 | 0.14 | 0.19 | % |
| Innovation | no data | no data | no data | no data | no data | no data | no data |
| GERD | 243.74 | 333.44 | 350.87 | 391.01 | 107.13*** | 24.88 | no data |
| Patent applications | 194.84 | 126.94 | 114.14 | 53.79 | -80.71*** | 5.33 | Number/mn inhabitants |
| High-tech patent applications | 21.28 | 17.62 | 27.89 | 15.10 | 6.61*** | 1.05 | Number/mn inhabitants |
| EUTM applications | 201.12 | 68.23 | 150.14 | 66.63 | -50.98*** | 4.43 | Number/mn inhabitants |
| Productivity | no data | no data | no data | no data | no data | no data | no data |
| Employment in technology and knowledge-intensive | 3.60 | 1.26 | 6.19 | 2.17 | 2.59*** | 0.09 | % of total employment |
| HRST | 861.81 | 1,030.94 | 631.02 | 180.65 | -230.78*** | 26.80 | % of total population |
| Competitiveness-enhancing characteristics | no data | no data | no data | no data | no data | no data | no data |
| Manufacturing firms | 18,482.45 | 23,442.45 | 4,383.02 | 1,105.25 | -14,099.43*** | 624.82 | Number |
| Population density | 281.08 | 186.95 | 1,904.68 | 3,068.07 | 1,623.61*** | 127.92 | Inhabitants/km2 |
Source: our work from Eurostat database (2021).
OTHER FIGURES
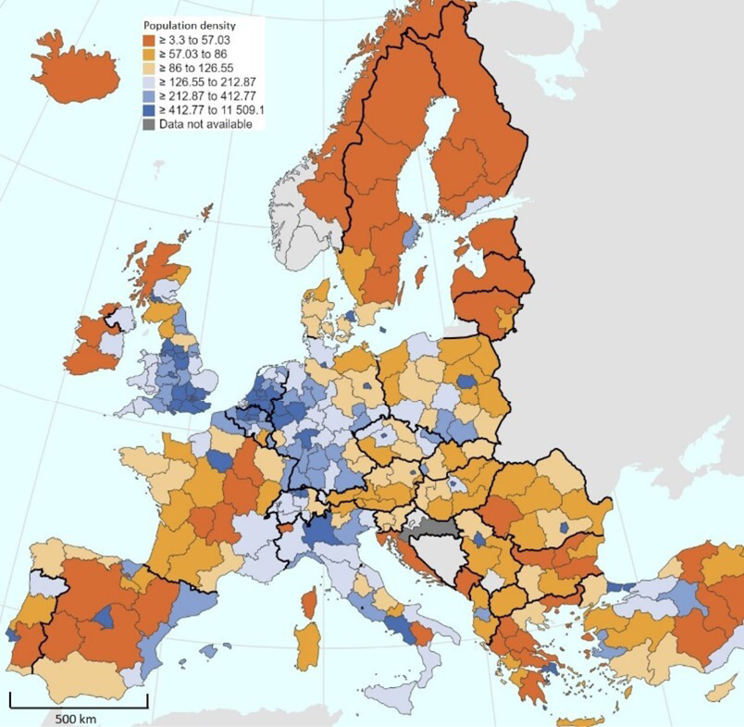
Source: own work based on Eurostat data.
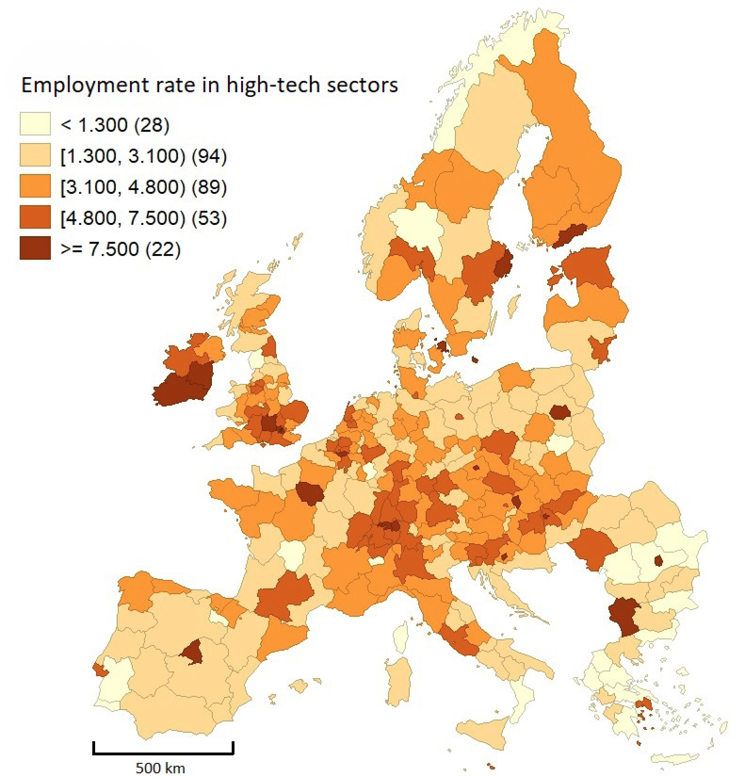
Source: own work based on Eurostat data.
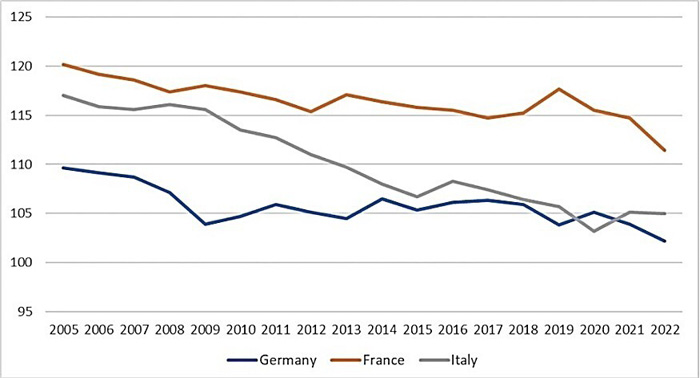
Source: own work based on Eurostat data.
Notes: Regions of the NUTS-2 area included in the Blue Banana are described in Fig. 1 (right). It is worth considering that the regions of Switzerland also were not considered as they are not part of the Eurostat database. NEET stands for “Young people (aged 15–29) neither in employment nor in education and training”, GERD stands for Gross domestic expenditure on Research and Development, EUTM for European Union trademarks, HRST for Human Resources in Science and Technology. Birth rate is defined as the number of enterprise births in the reference period divided by the number of enterprises active in the same period (in percentage). For the exact definition of the variables, see Eurostat website. The (unweighted) means are calculated over the 2000–2009 period (Table 1) and 2010–2019 (Table 2) for all NUTS-2 regions, except for Patent applications and GERD and patent application (for which the latest data refers to the mean refers to 2002–2012) and EUTM applications (for which the latest data refers to 2005–2015). Data on the enterprise birth ratio is collected from 2011 on. The NACE classification of economic activities changed in 2008, so data for the employment considered as technology and knowledge-intensive and the share of manufacturing firms cannot be compared for the 2000–2009 and 2010–2019 periods (but they can still be compared in the same period). Moreover, there is comparable data for the UK until 2019 for the Employment rate, the NEET rate and the early leavers from education, while the other data is collected only until 2016, when the Brexit referendum took place.
FOOTNOTES
- 1 Other names have been proposed for Brunet’s European backbone, including the term “blue banana”, partly attributed to Jacques Chérèque. According to Brunet himself, the “blue” color came from the geographical representation in an article by Alia (1989) in the French magazine Nouvel Observateur. According to other interpretations, the color could also recall the flag of the European Union, or the clothes worn by the so-called blue collars.
- 2 There are other densely populated NUTS-2 regions, which are mainly the agglomerations of capital cities, beyond the Blue Banana. However, they are rather isolated areas and geographically less continuous than the Blue Banana.
- 3 The authors indicate that the concept of territorial attractiveness is different from that of territorial competitiveness (Musolino and Kotosz, 2024).
- 4 An acronym that stands for young people “Not in Education, Employment or Training”.
- 5 While the 2000–2009 and the 2010–2019 periods cannot be compared, as the classification of the jobs considered as technology and knowledge-intensive changed in 2008, in the two separate periods Italy has a higher rate than the rest of the Blue Banana.
- 6 Indeed, larger Italian firms have been deemed more competitive than their international counterparts, see Calcagnini and Travagnini (2014).
- 7 For more information about the changes in the RCI methodological framework, see the 2022 edition of the EU Regional Competitiveness Index 2.0: https://ec.europa.eu/regional_policy/sources/work/rci_2022/eu-rci2_0-2022_en.pdf.
- 8 Due to Brexit, UK areas are not included in the dataset.
- 9 Musolino and Kotosz (2024) used the data from the application of the BAP (Budget Allocation Process) method from 2010 to 2017 and the application of the factor analysis as an aggregating method in the same time interval.
- 10 Additional regions in central Italy can be identified, namely Tuscany and Lazio. It is evident that tourism could also foster the attractiveness of these northern and central regions in terms of cultural and artistic heritage, food and wine tourism, winter tourism, etc. (Musolino and Kotosz, 2024).
- 11 “Not in employment, education or training”, young people aged 15 to 29.
- 12 Defined as persons aged 18 to 24 who meet the following two conditions: (a) the highest level of education or training they have completed is ISCED 2011 level 0, 1 or 2 (ISCED 1997: 0, 1, 2 or 3C short), corresponding to lower secondary education, and (b) they have not received any education or training (i.e. neither formal nor non-formal) in the four weeks preceding the survey.