Abstract. Increased visitor arrivals and improved work opportunities in the discussed destinations resulted in infrastructural development and settlement movements, culminating in the urbanisation of the locations. As a result of increased tourist flows and growing economic dependency on the tourism sector, the accommodation and other tourist infrastructure have contributed to a change in built-up areas considerably in tourist areas. Most green spaces in environmentally vulnerable locations are being filled with concrete due to a lack of appropriate spatial development guidelines, while urban areas are losing their authentic aspects. The paper attempts to understand spatial sustainability through the measures of land consumption rate and land-use efficiency in various types of tourist places. As a result, the study concludes that there is a strong link between growing urbanisation and changing visitor arrivals, as well as population change, and tourism has a substantial influence on spatial sustainability.
Key words: tourist inflow, built-up, consumption, spatial, sustainability.
The travel and tourism industry grew at a faster rate than the world economy, at a rate of 3.9% (WTTC,[1] 2019). It has generated one in five new jobs over the last five years with a 10.4% contribution to the global GDP (WTTC, 2019). Tourism is also represented as a spatial interaction between three regions –tourist generating regions where tourists start their trip, transit regions facilitating travel, food and lodging establishments, and tourist destination regions as places to supply tourism products and serves as the main motivations for undertaking trips (Leiper, 1979). Among those three, tourist destination regions are the places of various attractions and tourism activities that serve as the main motivation for tourists to visit. A tourist destination is considered to be the focal point for tourists for the quality of experience, tourism providers for marketing, and local residents for quality of life. In addition, tourism acts as a catalyst for the development of a destination in generating income, employment, foreign investments, conservation of heritage and eco-sensitive areas, and improving quality of life (Pechlaner et al., 2020). Hence, such destinations are economically dependent on tourism to a significant extent and the development is shaped by tourist flow. By dint of the perceived economic contribution of tourism, countries have adopted tourism development as an important and integral element in their development strategies (Jenkins 1991a, p. 61), which is primarily seen as the symbol of progress and modernisation, especially in developing countries (Roche, 1992; Sharpley, 2019, p. 566).
In developing countries like India, tourism has a vital role in boosting economic, social and cultural development. The travel and tourism sector is considered to be the largest service sector in India with total contributions of 9.2% to GDP and 8.1% to employment (FICCI,[2] 2019). According to WTTC, India moved forward from 52nd rank in 2015 to 34th rank in 2019 in travel and tourism competitiveness, with great performance scores in cultural resources and business travel, business environment, natural resources, and price competitiveness but the lowest performance in tourist service and infrastructure, environmental sustainability, and ICT readiness. A 2018 economic impact report by the World Travel and Tourism Council (WTTC) mentioned that India was expected to establish itself as the third-largest travel and tourism economy by 2028 in terms of direct and total GDP.[3] After the effect of the economic crisis in 2009, many initiatives such as Incredible India, Athithi Devo Bhava, and Swadesh Darshan Scheme have been initiated, maintaining India as an attractive and tourist-friendly destination, in order to boost the economy (Jaswal, 2014; Pandey and Mishra, 2017). Additionally, such push factors as an increase in disposable incomes, new forms of tourism, easier means of transport and communication through technological developments, and the desire of people to travel for leisure and recreation has bound tourism to grow rapidly. In 2017, 59.7% of tourist arrivals were for the purpose of leisure, holiday and recreation followed by business and professionals with 13.6% (MoT,[4] 2017). Also, 2017 was a remarkable year for India, with 10.04 million foreign tourists for the first time with a sharp growth rate of 14.7% from 2016 which remained steady until the COVID-19 outbreak. Such growth trends of tourist arrivals pressured the destinations to develop infrastructure such as hotels, restaurants, theme parks, resorts, and other tourism infrastructure in order to accommodate the tourists and boost the economic benefits. In addition, improved work possibilities in the tourist industry have resulted in population movement to the locations. As a result, there was a dramatic increase in land consumption and changes in land cover and land use in tourist areas for the last decade from 2009 to 2019, caused either directly or indirectly by tourism development. Most green spaces in eco-sensitive areas are being filled with concrete, while urban areas are losing their authentic look due to a lack of proper guidelines for planning and monitoring tourist destinations. Furthermore, challenges like congestion, crowding, trash, damage to religious and heritage monuments, pollution, and overburdened infrastructure are visible, resulting in lasting effects on tourism landscapes. The degrading visual appearances may affect the quality of experience for tourists and quality of life of residents as well. As a result, tourism is viewed as a danger to local sustainability with uncontrolled consumption patterns in the tourism sector, which could be a phenomenon of overtourism.[5]
As a result, it is expected that the tourist industry shall consume a substantial amount of land, resulting in additional effects on inhabitants, particularly in places that rely heavily on tourism for economic advantages. Butler’s evolution theory of tourist regions (1980)[6] also addressed the relationship between changing tourist arrival numbers and the changing phases of the development of an area, hence the assumption in this study is legitimate. The spatial sustainability[7] of each destination is evaluated using indicators supplied by the Global Human Settlement Layer (GHSL) to quantify land consumption and land-use efficiency, recommended SDG indicators for implementation of 2030 Agenda[8] (United Nations, 2017; UN-Habitat, 2018). Moreover, it is underlined that though tourism is mentioned specifically in SDG goals 8, 12 and 14, it has the potential to contribute to other goals of sustainable development (Meuleman, 2020), and, hence, the linkages of sustainable tourism and sustainable development are partial and incomplete (Rasoolimanesh et al., 2020) until they are addressed. One such key issue to address is the influence of tourism on the spatial sustainability of tourist destinations and, therefore, additional indicators are introduced for the case of tourism destinations. In addition, the need of monitoring the spatial sustainability of destinations is stressed in this study under SDG 11 (i.e., Sustainable Cities and Communities) along with its impact on sustainable tourism, in order to achieve sustainable development.
The structure of the paper contains five sections in sequence. The first section is an introduction addressing the concern and needs of the study. The second section discusses the facts and findings from a literature review. The third section discusses the data collection methods, data processing, and quantitative measures used for the study. The fourth section provides results and a discussion of the findings in the study. The fifth section is a conclusion providing a brief summary, recommendations, and the further scope of the research.
Tourism has a specific potential to protect the environment, shape spatial structures, and improve social challenges along with elevating the economy of a destination. As a result of the growth in tourist arrivals, destinations transform natural spaces into concrete spaces, through the development of tourist facilities such as accommodation facilities, restaurants, information centres, resorts, etc., shaping the built-up area in different stages of development (Gilbert, 1989; Christaller, 1939, Stansfield, 1978; Butler1980). Evolutionary models such as the resort or destination life cycle models (Gilbert, 1939; Defert, 1954; Christaller, 1964; Plog, 1973; Butler, 1980; Hovinen, 1981; Haywood, 1986; Hovinen, 1982; Young, 1983; Choy, 1992; Getz, 1992; Agarwal, 1992; Goncalves and Aguas, 1997), morphological models (Weaver, 1993; Barrett, 1958; Meyer-Arendt, 1990, p. 40; Stansfield, 196; Lavery, 1971) have proved the existence of a relation between tourist arrival growth and the spatial development in a destination. However, the relationship between tourism and the physical environment is reciprocal. Intensified tourist flow results in an accelerated growth of a built-up area which leads to issues of uncontrolled and unplanned growth (Anbalagan, 1993), which in turn may lead to degrading the attractiveness, which may further affect the visitor experience. Overtourism and overdevelopment, forms of unsustainable and unregulated tourism, are two major phenomena threatening a destination’s sustainability (Butler, 2019), which may induce the issues such as water scarcity, land scarcity, pollution, land degradation, exploitation of forest resources, etc. There has been a considerable discussion on such negative impacts of tourism on the natural and socio-cultural environments since the 1970s. To address all such issues, the sustainable development approach has also been discussed widely in tourism (Lane, 1991, p. 2; ETB, 1991; UNWTO, 1993; Godfrey, 1993; De Boer, 1993; Butler, 1996; Hunter, 1997, pp. 860–862; Adillon, 2019). The sustainable tourism that arose from Agenda 21 (UN, 2000) with the purpose of eradicating poverty mostly focused on the sustainability of tourism as an economic activity. Later, the 2030 Agenda (UN, 2015) highlighted sustainable tourism to combat water scarcity and pollution, strengthen cooperation on desertification, dust storms, land degradation and drought, and promote resilience and disaster risk reduction, reflecting the targets of SDGs 8, 12, and 14 for achieving Sustainable Development. However, the influence of tourism on other goals is rarely discussed. Meuleman (2020) stated that “As a priority, it is convenient to evaluate or formulate metrics for objectives 8, 12, and 14, which have been identified as those in which tourism plays an important role. However, it will be appropriate to address all SDGs because tourism directly or indirectly affects all of them, and in turn, all the SDGs are interrelated.” Specifically, the influence of tourism on SDG 11.3.1 which measures land consumption and population growth pattern is not spotlighted. SDG 11.3.1 is targeted to monitor the utilisation of land in urban areas through a ratio of Land Consumption Rate to Population Growth Rate (LCRPGR). As mentioned in Butler’s theory of destination’s life cycle (1980), the development stage has a huge impact on the transformation of a destination with accommodation facilities, transport network, civic amenities, etc., which greatly influences the built-up area and also may lead to urbanisation with the internal migrant population. Therefore, there exists a strong relation between tourist arrival growth and the utilisation of land. Hence, monitoring land utilisation using the existing indicators recommended in SDG 11.3.1 may not provide the actual idea in the case of tourist destinations. Therefore, this paper contributes to exploring the influence of tourist growth rate on land utilisation rate and its efficiency for achieving sustainable development.
India is diverse with different cultures, traditions, and many other natural attractions, which creates an interest to make India a destination choice for tourists. It offers a variety of destinations that include heritage sites, religious sites, nature-based sites, and a combination of all of them, with different geographical characteristics such as plain, hilly or mountainous areas that include rural areas, small towns, medium towns, and large cities and metropolitan cities. It is one of the fastest developing countries with tourism as an important source for the economy, attracting a large number of domestic and international tourists from around the world. The country has witnessed an increasing trend in domestic tourist arrivals for the last two decades with a CAGR[9] of about 26.1% from 1997 to 2017. Foreign tourist arrivals witnessed a CAGR of 8.26% from 1997 to 2017, following an increasing trend except for marginal declines in the years 2002, 2009, 2012, and 2020. International tourist arrivals are expected to reach 30.5 billion by 2028 (MoT, 2020). Tourism contributed about 9.4% to India’s GDP in 2017 with domestic tourism alone accounting for 88% of the sector (MoT, 2017). The industry has been recognised as the fastest growing sector in India with emerging tourism segments such as medical tourism, pilgrimage tourism, eco-tourism, adventure tourism, heritage tourism, rural tourism, and luxury tourism. The study selected around 20 popular destination areas with varied topographies and tourism activities for the analysis.
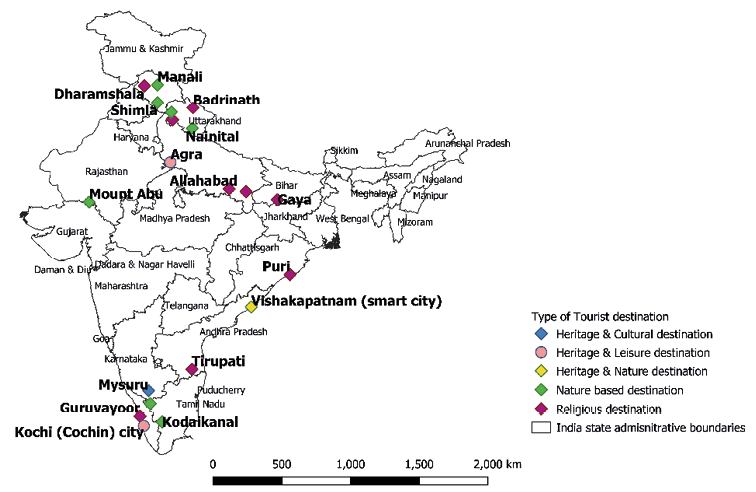
Fig. 1. Location of selected destinations for the study
Source: own work.
The case studies are categorised based on the promoted experiences and attractions in the destination through the Incredible India campaign assuming that majority of the tourists visit to experience the same things in the same destinations. Also, the destinations are categorised based on the size of the population defined in URDPFI[10] guidelines (2014). Areas with a population ranging from 10 lakh to 1 crore are defined as metropolitan cities, 5 to l0 lakh as large cities, 1 to 5 lakh as medium towns, and 5000 to 50,000 as small towns. Also, there is an exception that any urban area with a population of less than 5,000 may be called a statutory town.
| Destination | Administrative boundary (State, country) | Type of Settlement | Major Tourism activity | Terrain | Category |
|---|---|---|---|---|---|
| Agra | Uttar Pradesh, India | metropolitan city | heritage and leisure | plain | heritage – metro city |
| Allahabad | Uttar Pradesh, India | metropolitan city | religious and heritage | plain | religious – metro city |
| Badrinath | Uttarakhand, India | statutory town | religious and nature | mountainous | religious – rural town |
| Dharamshala | Himachal Pradesh, India | small town | religious and nature, adventure | mountainous | religious town |
| Gaya | Bihar, India | medium town | religious and heritage | plain | religious – city |
| Guruvayoor | Kerala, India | small town | religious | plain | religious– town |
| Haridwar | Uttarakhand, India | medium town | religious and nature | mountainous | religious – city |
| Kochi (Cochin) | Kerala, India | large city | heritage and leisure, wellness | plain | heritage – coastal city |
| Kodaikanal | Tamil Nadu, India | small town | nature and leisure | hill | hill town |
| Manali | Himachal Pradesh, India | statutory town | nature and heritage, adventure | mountainous | hill – a rural town |
| Mount Abu | Rajasthan, India | small town | nature | hill | hill town |
| Mussoorie | Uttarakhand, India | small town | nature and heritage, adventure | mountainous | hill town |
| Mysuru | Karnataka, India | large city | heritage and culture | hill & plain | heritage – city |
| Nainital | Uttarakhand, India | small town | nature and heritage, adventure | hill | hill town |
| Puri | Orissa, India | medium town | religious and culture | plain | religious – coastal city |
| Shimla | Himachal Pradesh, India | medium town | nature and leisure, adventure | hill | hill – city |
| Tirupati | Andhra Pradesh, India | medium town | religious and heritage | hill & plain | religious –city |
| Udhagamandalam (Ooty) | Tamil Nadu, India | medium town | nature and leisure, adventure | hill | hill town |
| Varanasi | Uttar Pradesh, India | metropolitan city | religious and culture | plain | heritage – metro city |
| Vishakapatnam (smart city) | Andhra Pradesh, India | metropolitan city | nature and heritage, adventure | plain | heritage – coastal metro city |
The study adopts an indicator approach to measure the land consumption rate and land-use efficiency of the destinations. The indicator values are plotted to identify the relationship and understand the spatial sustainability of the destinations. The 2030 Agenda goal devoted to sustainable cities and communities, i.e., SDG 11, has listed many indicators to monitor at the city scale. Among them, land consumption rate to population growth is specified as a Tier II indicator (method established with poor data) as mentioned under SDG 11.3.1, which could be improved with satellite data over a broad geographical area. In a way to recover the data deficits, multiple dataset areas are developed to estimate urban expansion such as the Global Human settlement layer (GHSL), Global Urban Land (GUL), and Global Artificial Impervious Area (GAIA) (Liu, X. et al., 2020). However, the estimates from the mentioned datasets have not established any relationship between the function of a city and spatial growth, which is important for understanding spatial sustainability. Therefore, the indicators have been modified and additional indicators have been introduced with a critical perspective on spatial growth in tourist destinations at a city scale. The overall approach for the study is shown in the Fig. 2. The modified approach is specifically applied to tourist destinations where tourism contributes significantly to economic growth. In this approach, tourists are considered to be as important as the residents for the expansion of the built-up area. In addition, tourists are represented as temporary residents living for a short period creating significant long-term changes in the destination. Finally, residents and tourists are equally important stakeholders in the sustainable development of a tourist destination. Therefore, it is assumed that the changing of a built-up area is related to changing population and changing tourist arrivals in the destination.
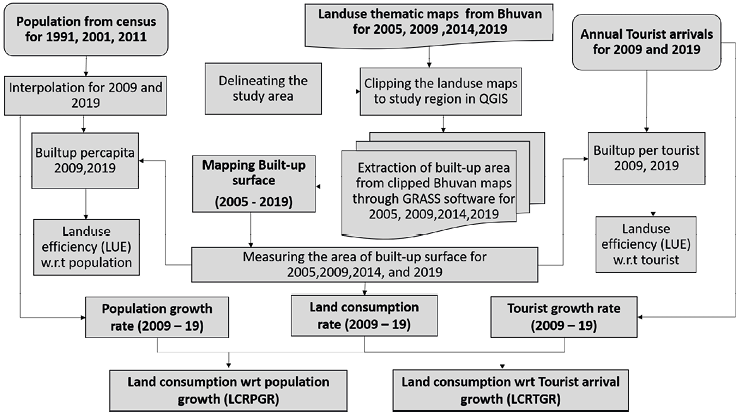
Fig. 2. Methodology
Source: own work.
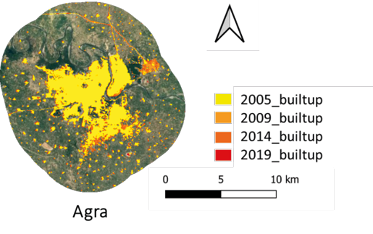
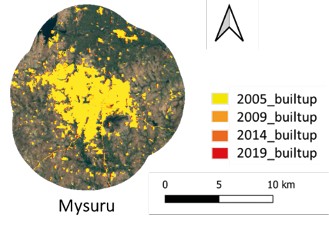
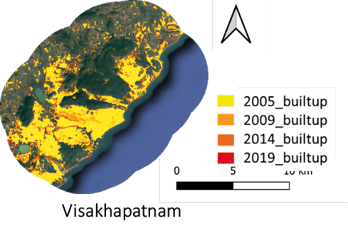
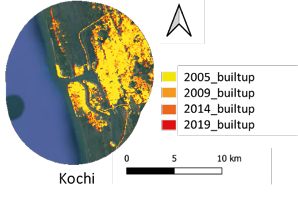
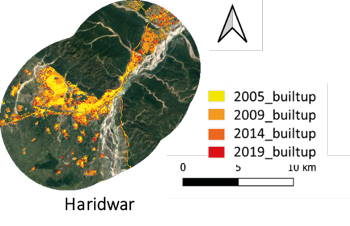
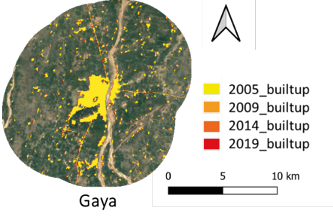
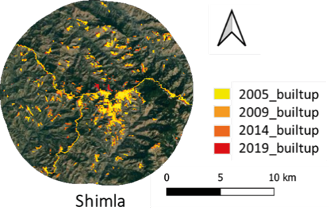
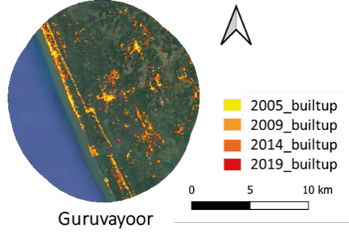
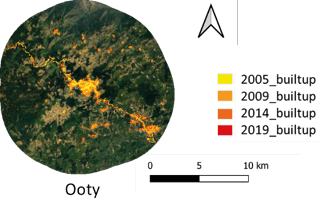
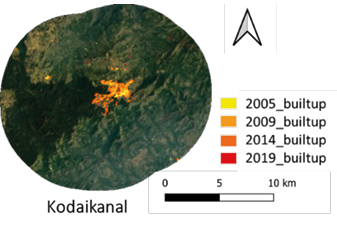
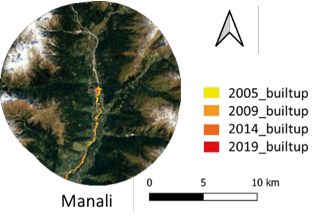
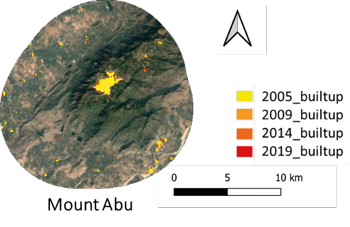
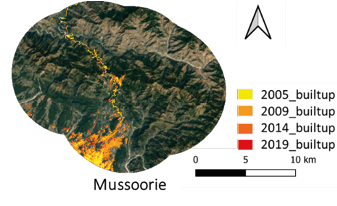
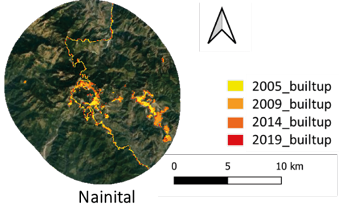
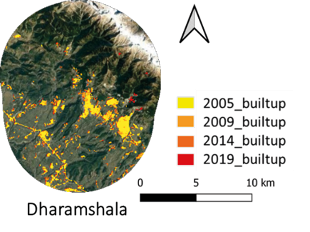
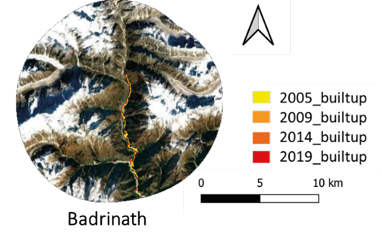
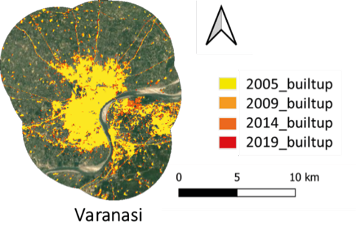
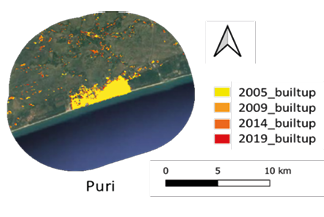
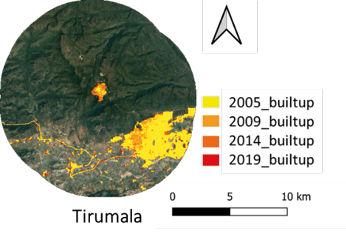
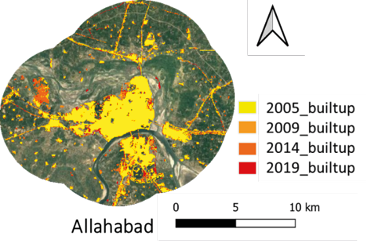
Land use maps at a scale of 1:250000 for these destinations were collected from Bhuvan[11] (http://bhuvan.nrsc.gov.in) for the years 2005, 2009, 2014, and 2019. The tourism activities were either concentrated or dispersed within or beyond the municipal boundaries of a destination and, therefore, a buffer of 10 km was also considered from the municipal boundary of the destination. Thus, the collected land use images have been clipped to case study areas with a buffer of 10 km. These raster images are reclassified with pixel values representing built-up areas through GRASS to extract only the built-up areas. The area of the pixels coming under the built-up class within the selected regions has been calculated for specific years. Tourist arrival data was collected for each destination from the statistics provided by the Ministry of Tourism, Government of India. The population data was collected for 1991, 2001, and 2011 from the census of India and interpolated for the years 2005 and 2019. The tourist arrival data of each destination was collected from the published sources by the state government, and published reports from the local authorities were available with tourist arrival data for the years 2005, 2009, 2014, and 2019. The missing tourist arrival data is interpolated from the tourist arrival rate trend line per year.
The land use and land cover data from the Bhuvan – Indian Geo platform of ISRO was obtained into QGIS by connecting the dataset as a WMS layer. The data was extracted for the study area in the form of an image in TIFF format at a 1:250,000 scale with fine resolution. An RGB band raster image was obtained, split into three raster images. Among them, band 2 was used to extract the built-up pixels which were reclassified as a binary image with built-up and non-built-up areas. The binary raster was then clipped to the study area and the amount of built-up area was measured in square metres.
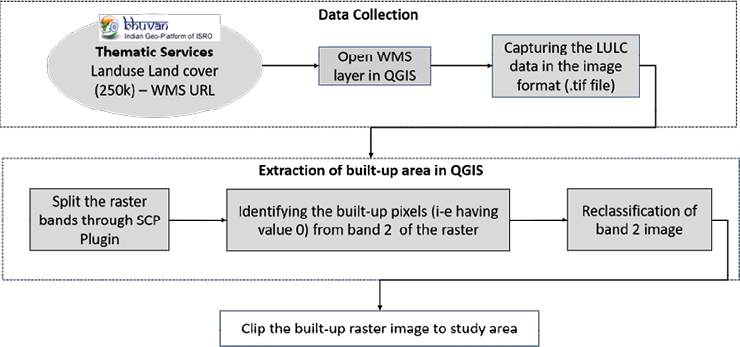
Fig. 3. Extraction of the built-up area from Bhuvan land use maps
Source: own work.
To understand land consumption through growing built-up areas in a region with increased intensity of tourism in the area and an increased size of settlement, the study adopted the SDG indicator 11.3.1, i.e., Ratio of Land Consumption Rate (LCR) to Population Growth Rate (PGR) to monitor the land use efficiency as recommended by UN-Habitat. Furthermore, the research includes an external indicator relevant to the situation of a tourist destination, based on the idea that guests leave a footprint that contributes to the use of natural resources (land, water, electricity, etc.) and have long-term effects on the destination. Furthermore, the research includes an external indicator relevant to the situation of a tourist destination, based on the idea that guests leave a footprint that contributes to the use of natural resources (land, water, electricity, etc.) and have long-term effects on the destination.
| Sub-Indicator | Definition | Formula |
|---|---|---|
| Land consumption rate (%) (UN-Habitat, 2015) |
The land consumption rate is defined as the rate at which land is being utilised for a specific purpos | LCR = (LN(BUt + n/BUt))/(y) where, BUt + n = Total built-up area in sq. km for past/initial year BUt = Total built-up area in sq. km for current/final year y = The number of years between the two measurement period |
| Population growth rate (PGR) (%) (UN-Habitat, 2015) |
The rate of change in the number of residents in a specific region (country, city, etc.) over a certain period of time | PGR = (LN(Popt + n/Popt))/(y) where, Popt + n = Total population within the city in the past/initial year Popt = Total population within the city in the current/final year y = The number of years between the two measurement periods |
| Tourist growth rate (TGR) (%) (UN-Habitat, 2015) |
The rate of change in tourist arrivals in a specific region (country, city, etc.) over a certain period of time, which is expressed as the percentage change in tourist arrivals growth per year | TGR = (LN(TAt + n/TAt))/(y) where, TAt + n = Total no. of tourists arrived within the city in the past/initial year TAt = Total no. of tourists arrived within the city in the final year y = The number of years between the two measurement periods |
|
*Ratio of land consumption rate to population growth rate (LCRPGR) = (LCR)/(PGR) *Ratio of land consumption rate to Tourist arrival growth rate (LCRTGR) = (LCR)/(TGR) |
||
To understand the spatial sustainability of a region, the study has adapted the approach of land use efficiency proposed by GHSL, in order to support the indicator of SDG 11.3.1 for monitoring the implementation of the 2030 development agenda. For the specific case of tourist destinations, additional sub-indicators are used to understand the influence of tourism on spatial sustainability of the region.
| Sub-Indicator | Definition | Formula |
|---|---|---|
| Built-up per resident (sq. km per resident) (UN-Habitat, 2018) |
The average amount of built-up area available per each resident in the defined area as a destination | Bu_R = (But/Rt) where, But = Total built-up area in sq. km in the time ‘t’ (year) Rt is the number of residents in the defined area in time ‘t’ (year) |
| Built-up per tourist (sq. km per tourist) (UN-Habitat, 2018) |
the average amount of built-up area available per each tourist in the defined area as the destination | Bu_T = (But/Tt) where, But = Total Built-up area in sq. km in the time ‘t’ (year) Tt is the number of tourists in the defined area in time ‘t’ (year) |
| Built-up per capita (sq. km per person) (UN-Habitat, 2018) |
The average amount of built-up area available to each person in a defined area (country, city, etc.), which helps to identify the spatial distribution (i.e., densely or sparsely populated) of people (include both residents and tourists) | Bu_T = But /(Rt+Tt) where, But = Total built-up area in sq. km in the time ‘t’ (year) Rt is the number of residents in the defined area in time ‘t’ (year) Tt is the number of tourists in the defined area in time ‘t’ (year) |
|
* Resident land use efficiency = (Yt – Yt+n)/ Yt , Where , Yt = But / (Rt) * Tourist land use efficiency = (Yt – Yt+n)/ Yt , Where , Yt = But / (Tt) * Overall land use efficiency = (Yt – Yt+n)/ Yt , Where , Yt = But / (Rt + Tt) |
||
With the exception of a few areas, tourist arrivals have doubled or more than doubled as a consequence of heightened campaigning and marketing following the economic slump in most regions, which is evident in Fig. 4. Furthermore, as job opportunities and money creation have increased, the populations of the destinations’ urban areas have exploded. It goes without saying that as the population grows, so does the amount of built-up land. Hill destinations like Ooty, Kodaikanal, and Mussoorie, which are known for their natural scenic beauty, have witnessed remarkable increases in built-up areas, with a larger shift in tourist arrivals as compared to their populations, contrary to popular belief. Even well-known holy cities such as Allahabad and Varanasi have witnessed tremendous growths in built-up areas, as well as increasing tourist traffic and population. Agra, the most popular heritage destination, has seen a surge in weekend visitor traffic since the introduction of the fast route from Delhi, resulting in an expansion in its built-up area. The altering built-up area is a result of both increasing population and increased tourist numbers, according to this study.
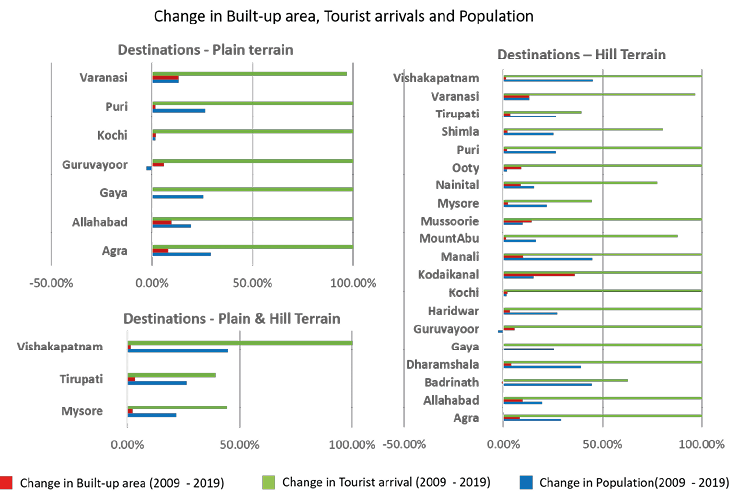
Fig. 4. Changing built-up area, tourist inflow and Population
Source: own work.
In accordance with the recommended indicator for monitoring SDG 11.3.1, i.e., the ratio of land consumption rate to population growth rate, the study presents the land consumption rate, population growth rate, and tourist growth rate of various destinations located in various geographical locations in Fig. 5. It has been noticed that sites famous for nature-based tourism, such as Kodaikanal, Mussoorie, Nainital, and Ooty, have high land consumption rates, greater visitor growth rates, and low population growth rates. It supports our hypothesis that tourism is a substantial contributor to the growth of built-up areas in tourist-dependent areas, particularly in hilly areas. Badrinath, however, has a negative land consumption rate, which might be attributable to the loss of built-up land following 2013 floods. However, this distant community has had a faster pace of population growth and a large increase in visitor visits. With such a rapid expansion, the town is under pressure from both tourists and residents, perhaps leading to an increase in built-up space. Furthermore, increased built-up area on such vulnerable ground may increase the region’s exposure to dangers. Except for Badrinath, all places with high hotel density have high land consumption rates. However, locations such as Agra, Allahabad, Kochi, Visakhapatnam, Varanasi, and Tirupati have a higher number of lodging establishments with a lower density. This might be the situation in metropolitan and big cities where tourism is one of the major sources of revenue, alongside other vital economic activities. For example, Kochi and Vishakhapatnam are also popular as industrial cities with port activities, coal and petroleum industries, and IT industries. Similarly, Agra and Allahabad are known as a cantonment board and are organically developed as historical cities. With a few exceptions, our analysis supports the notion that tourism-related built-up area occupies a significant share of the built-up area.
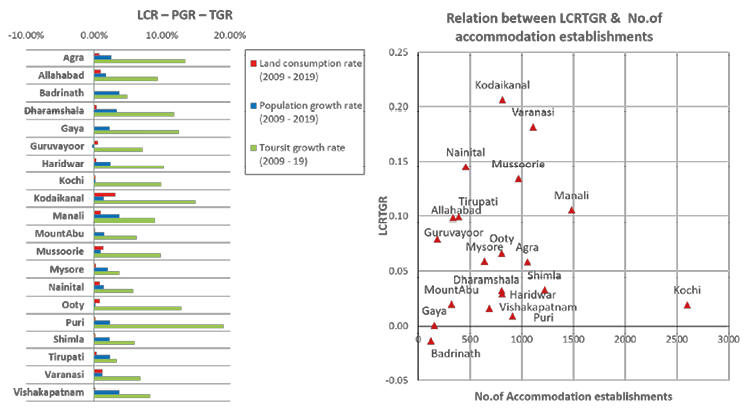
Fig. 5. Land consumption and the relation between the number of accommodation establishments with LCRTGR
Source: own work.
The perfect LCRPGR ratio for achieving sustainable development, according to UN-Habitat, is 1, with positive numbers showing progress towards efficiency and negative values suggesting a decrease in efficiency. The LCRPGR ratio is interpreted in terms of city density to determine land use efficiency.
| City density | LCRPGR <1 | LCRPGR >1 |
|---|---|---|
| 10–150 persons per hectare | Efficient land use | Inefficient land use |
| 151–250 persons per hectare | Moving toward efficiency | Moving away from efficiency |
| > 250 persons per hectare | Insufficient land per person | Moving toward sufficient land per person |
As illustrated in Fig. 6, the LCRPGR and LCRTGR ratios are computed and shown. The study’s chosen sites had population densities ranging from 10 to 150 people per hectare. As observed in the graph, Ooty, Kodaikanal, Mussoorie, and Guruvayoor have LCRPGR ratios larger than 1, indicating either inefficient land use or a shift away from efficient land use. Despite their close proximity to the optimal ratio, Shimla, Nainital, Manali, and Dharamshala exhibit evidence of uncontrolled growth. Kochi, a beach city, and Varanasi, a holy heritage city, have proved that they are closer to meeting the right ratio for sustainable growth. The majority of religious and heritage locations are making more efficient use of land having relatively lower land consumption rate.
The study has been the first to plot LCR and TGR data to evaluate the impact of tourist expansion on land consumption rates and to provide a standard for interpreting LCRTGR and LCRPGR for monitoring a destination’s spatial sustainability. The LCRTGR standard is assumed to be 0.05, determined from the figure given in Fig. 7, for destinations that have proven a consumptive use of land. The benchmark is set arbitrarily based on the increase of built-up areas in the studied regions. Other indicators established by the Global Human Settlement Layer (GHSL) to measure land use efficiency are also utilised to validate the assumption.
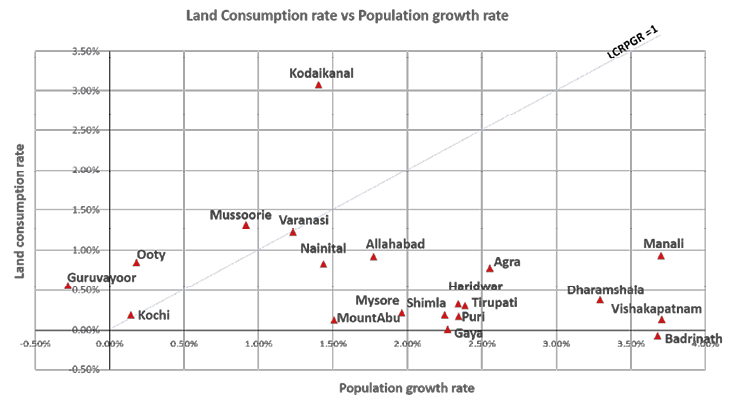
Fig. 6. Land consumption rate versus population growth rate
Source: own work.
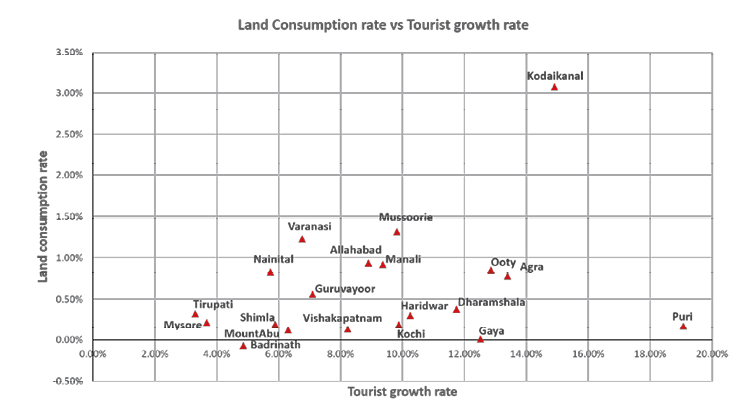
Fig. 7. Land consumption rate versus tourist growth rate
Source: own work.
The land consumption per resident or tourist is calculated as the change in built-up per resident or tourist over a period and is expressed as a percentage change in built-up available for residents or tourists. Positive numbers imply more land consumption per person, whilst negative values indicate lower land consumption per person by those percentage points. The changing consumption of land per resident and visitor in the location is presented in Fig. 8. It is obvious from this research that land consumption patterns are shifting in all of the destinations. The decreasing trend in land consumption per capita indicates that some cities are becoming more compact, whereas the growing trend indicates that other cities are becoming more sprawled. It is apparent that, between 2009 and 2014, the destinations grew in size as the demand for land increased for inhabitants and tourists. In highland locations such as Ooty, Nainital, and Mussoorie, land usage per inhabitant climbed dramatically until 2014, but dropped precipitously between 2014 and 2019. Badrinath is an exception, with land loss resulting in a reduction in built-up per capita from 2009 to 2014. However, from 2014 to 2019, there was an upward tendency in land consumption per inhabitant, indicating that the region was going to expand spatially.
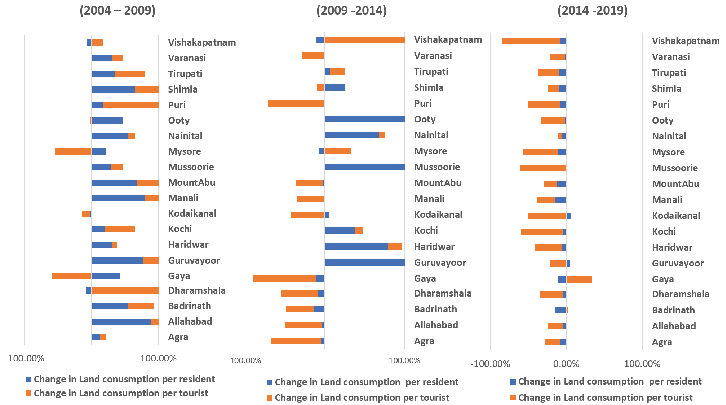
Fig. 8. Temporal patterns of land consumption
Source: own work.
All religious locations with flat terrain are transforming into compact metropolitan areas that can accommodate both inhabitants and tourists. However, due to growing populations and tourist traffic, it is apparent that the built-up area rose dramatically from 2004 to 2009. Coastal cities such as Visakhapatnam and Kochi were sprawling due to the effect of land consumption patterns brought on by tourist traffic until 2014. The trend from growing land consumption in 2004–2009 to diminishing tendencies in 2014–2019 indicates that all destinations are moving towards a compact urban form or densification. There are a few exceptions, such as Guruvayoor, which has a shrinking population and is spreading, and Badrinath, which lost land due to floods in 2013. Due to the creation of industrial townships such as the BHEL township in Haridwar and IT parks in Kochi, land consumption per inhabitant in Kochi and Haridwar is significantly higher than that of tourists. The reduced trend in land consumption per resident and visitor may also be argued as concerns of land scarcity due to restricted land availability and physical limits within the study’s designated region.
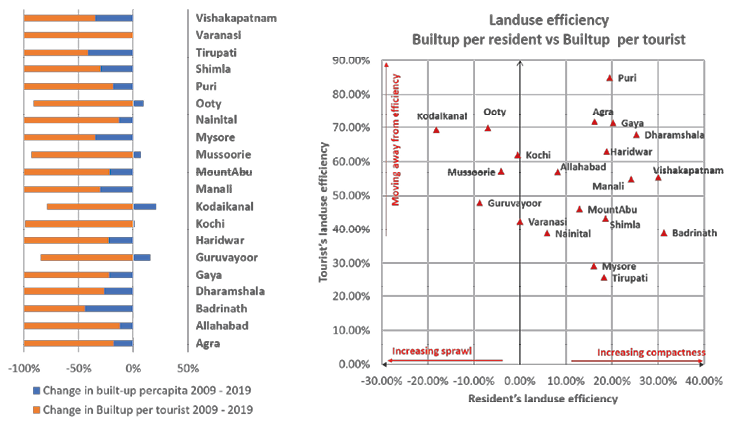
Fig. 9. Resident land use efficiency versus tourist land use efficiency
Source: own work.
The plot of efficiency of land use by inhabitants and visitors from 2009 to 2019 is shown in Fig. 9. Most destinations are becoming increasingly confined, with land usage becoming increasingly constrained. Yet areas like Ooty, Kodaikanal, Mussoorie, and Guruvayoor are spreading over the region, with a substantial increase in built-up space. Kochi and Varanasi have virtually reached the ideal LCRPGR ratio (i.e., 1), indicating that the population and built-up area are rising at the same rate and demonstrating effective land use. However, the rate of land consumption is higher in Varanasi, which corresponds to the increasing trend of visitor arrivals and lodging establishments in the area. This shows that tourism is a key contributor to the growth of built-up areas in tourist locations. As a result, the assumption that visitors are transient residents who have a long-term influence on a destination’s spatial shape is valid. Furthermore, there is substantial evidence that hill cities in the Western Ghats area are suffering urban expansion and are far from making optimal use of land. An increased expansion in hilly areas may result in the loss of forest land and green cover, causing land degradation and posing serious danger to wildlife and environment. Due to land scarcity and unsuitability, few destinations in mountainous locations are moving towards compact built-up with ribbon expansion of accommodation establishments along the road network in the entire region. The compact type of built-up expansion in such mountainous places increases the vulnerability of such delicate sites, as seen in the case of Badrinath, a holy mass tourist attraction in an eco-fragile zone of the Himalayas.
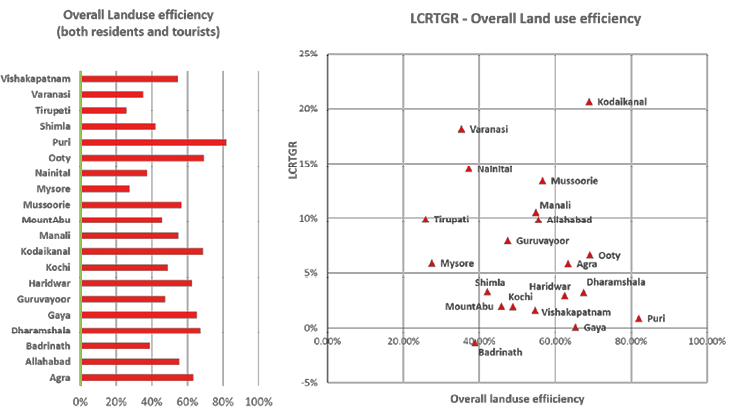
Fig. 10. Overall land use efficiency
Source: own work.
The overall land-use efficiency is estimated and displayed in Fig. 9 using built-up per capita as the built-up area available for the population, which is defined as the sum of the number of inhabitants and visitors in a year. The aggregate land-use efficiency percentage reflects how close the destinations are to achieving spatial sustainability. The influence of tourist flow on overall land-use efficiency is also depicted by a plot linking overall land-use efficiency to the LCTGR ratio. With an estimated LCTGR ratio of i-0.05 as a baseline, it is evident that all of the destinations are far from making optimal use of land. Puri, Dharamshala, Badrinath, Kochi, and Varanasi have indicated a change away from the path of sustainable land use by having reduced land consumption rates with the LCRPGR ratio equal to or less than 1 with almost efficient land use. This is due to the idea that visitors are also transitory inhabitants, which puts pressure on destinations to expand their built-up areas, diminishing the tourism regions’ spatial sustainability.
Tourism is mentioned specifically as a socio-economic phenomenon by UNWTO though it is a spatial phenomenon which induces socio-economic changes in a destination. The geographic characteristics and built characteristics play an important role to draw the attention of the tourists. To boost the arrivals, destination areas facilitate tourism with accommodations, food establishments, information centres, healthcare facilities, and civic amenities, all of which require land. In addition, it results in a large migration of the population into areas in search of livelihood opportunities. Thus, land is an essential resource required for tourism development which is limited in supply but in high demand. Yet with excess tourist flow, there have been massive constructions in fragile areas such as hilly or coastal regions, without any suitability or vulnerability analysis in the name of tourism development. Hence, tourists have become a part of the destination development, and are the consumers of land resources for accommodation infrastructure, which further includes consumption of water resources, energy, etc. Through this analysis we have attempted to provide evidence of increasing sprawls and agglomerations, high land consumption rates with increasing tourist arrivals in tourist areas, that would result in uncontrolled and haphazard growth. Such growth in the destinations is leading to inefficiency in land management due to a lack of proper legislation, and planning and development controls, which may lead to failure in achieving sustainable tourism development. Immediate attention is needed to integrate the components of the tourism system in regional planning with a decentralised system of governance dealing with problems of crowding, congestion, and environmental degradation. The growth patterns of tourism destinations have to be continuously monitored to avoid illegal constructions, and haphazard growth, and spatial carrying capacity of the infrastructure have to be studied considering the natural risks and socio-economic vulnerabilities of the regions. The development of a spatial monitoring system to identify the unplanned growth of built-up resulting from tourism activity is a key challenge in monitoring spatial sustainability. The spatio-temporal growth pattern of built-up areas and its relation to the spatial distribution of hotel investments should be considered further to assess the impact of tourism on spatial sustainability. The study provides a future direction for integrating spatial planning in tourism development, which would be a strong instrument for achieving sustainable tourism, as well as sustainable development of the tourist regions. It is suggested to include sustainable tourism as a target in SDG 11 for sustainable cities and communities through monitoring land consumption patterns in the destinations and suitable spatial policies need to be recommended for the sustainable development of the destinations.
ANBALAGAN, R. (1993). Environmental hazards of unplanned urbanization of mountainous terrains: a case study of a Himalayan town, Quarterly Journal of Engineering Geology and Hydrogeology, 26 (3), pp. 179–184. https://doi.org/10.1144/GSL.QJEGH.1993.026.003.03
BAPORIKAR, N. (2017), Critical Review of Tourism in India. Tourism and Opportunities for Economic Development in Asia, pp. 149–169. https://doi.org/10.4018/978-1-5225-2078-8.ch010
BUTLER, R. W. (1980), ‘The concept of tourism area cycle of evolution: implications for management of resources’, Canadian Geographe, 24 (1), pp. 5–12. https://doi.org/10.1111/j.1541-0064.1980.tb00970.x
CAI, G., ZHANG, J., DU, M., LI, C. and PENG, S. (2020), ‘Identification of urban land use efficiency by indicator-SDG 11.3. 1’, PloS one, 15 (12), e0244318. https://doi.org/10.1371/journal.pone.0244318
CORBANE, C., POLITIS, P., PESARESI, M., KEMPER, T. and SIRAGUSA, A. (2018), Estimation of land use efficiency from the Global Human Settlement Layer (GHSL), QGIS and Applications in Territorial Planning, 3, pp. 39–52. https://doi.org/10.1002/9781119457121.ch2
CENSUS OF INDIA (2011), Census of India, https://censusindia.gov.in/
DEY, J., SAKHRE, S., GUPTA, V., VIJAY, R., PATHAK, S., BINIWALE, R. and KUMAR, R. (2018), ‘Geospatial assessment of tourism impact on land environment of Dehradun, Uttarakhand, India’, Environmental Monitoring and Assessment, 190 (4), pp. 1–10. https://doi.org/10.1007/s10661-018-6535-4
ESTOQUE, R. C., OOBA, M., TOGAWA, T., HIJIOKA, Y. and MURAYAMA, Y. (2021), ‘Monitoring global land-use efficiency in the context of the UN 2030 Agenda for Sustainable Development’, Habitat International, 115, 102403, pp. 1-10.
JALILOV, S. M., CHEN, Y., QUANG, N. H., NGUYEN, M. N., LEIGHTON, B., PAGET, M. and LAZAROW, N. (2021), ‘Estimation of Urban Land-Use Efficiency for Sustainable Development by Integrating over 30-Year Landsat Imagery with Population Data: A Case Study of Ha Long, Vietnam’, Sustainability, 13 (16), p. 8848. https://doi.org/10.3390/su13168848
JASWAL, S. S. (2014), ‘Role of tourism industry in India’s development’, Journal of Tourism and Hospitality, 3 (2), pp. 1–6. https://doi.org/10.4172/2167-0269.1000126
JENKINS, C. L. (1982), ‘The effects of scale in tourism projects in developing countries’, Annals of Tourism Research. 9 (2), pp. 229–249. https://doi.org/10.1016/0160-7383(82)90047-0
JIANG, H., SUN, Z., GUO, H., WENG, Q., DU, W., XING, Q. and CAI, G. (2021), ‘An assessment of urbanization sustainability in China between 1990 and 2015 using land use efficiency indicators. Npj Urban’, Sustainability, 1 (1), pp. 1–13. https://doi.org/10.1038/s42949-021-00032-y
KUMAR, B. M. (2006), ‘Land use in Kerala: changing scenarios and shifting paradigms’, Journal of Tropical Agriculture, 43, pp. 1–12.
KYTZIA, S., WALZ, A. and WEGMANN, M. (2011), ‘How can tourism use land more efficiently? A model-based approach to land-use efficiency for tourist destinations’, Tourism Management, 32 (3), pp. 629–640. https://doi.org/10.1016/j.tourman.2010.05.014
LEIPER, N. (1979), ‘Towards a definition of tourism, tourist, and the tourist industry’, Annals of tourism research, 6 (4), pp. 390–407. https://doi.org/10.1016/0160-7383(79)90003-3
LI, C., CAI, G. and SUN, Z. (2021), ‘Urban Land-Use Efficiency Analysis by Integrating LCRPGR and Additional Indicators’, Sustainability, 13 (24), p. 13518. https://doi.org/10.3390/su132413518
LIU, X., HUANG, Y., XU, X. et al. (2020), ‘High-spatiotemporal-resolution mapping of global urban change from 1985 to 2015’, Nature Sustainability, 3, pp. 564–570. https://doi.org/10.1038/s41893-020-0521-x
MAO, X., MENG, J. and WANG, Q. (2014), ‘Modeling the effects of tourism and land regulation on land-use change in tourist regions: A case study of the Lijiang River Basin in Guilin, China’, Land Use Policy, 41, pp. 368–377. https://doi.org/10.1016/j.landusepol.2014.06.018
MASON, P. (2020), Tourism impacts, planning and management, Routledge.
MEULEMAN, L. (2019), Metagovernance for sustainability: A framework for implementing the sustainable development goals, Routledge.
NETELER, M., BOWMAN, M. H., LANDA, M. and METZ, M. (2012), ‘GRASS GIS: A multi-purpose open source GIS’, Environmental Modelling & Software, 31, pp. 124–130.
PANDEY, S. K. and MISHRA, A. K. (2017), ‘Effectiveness of IGNOU Tourism Education Programmes for Human Resource Development and Sustainable Tourism in Varanasi’, Indian Journal of Human Relations, 51 (2), pp. 202–213.
PECHLANER, H., INNERHOFER, E. and ERSCHBAMER, G. (Eds.). (2020), Overtourism: Tourism management and solutions, Routledge.
PROSSER, R. (1998). ‘Tourism’, In the Encyclopaedia of Ethics, 4, pp. 373–401, Chicago, IL: Houghton Mifflin.
QGIS DEVELOPMENT TEAM (2019), QGIS Geographic Information System, Open Source Geospatial Foundation. URL: http://qgis.org
RASOOLIMANESH, S. M., RAMAKRISHNA, S., HALL, C. M., ESFANDIAR, K. and SEYFI, S. (2020), ‘A systematic scoping review of sustainable tourism indicators in relation to the sustainable development goals’, Journal of Sustainable Tourism, pp. 1–21.
SAHA, J. and PAUL, S. (2021), ‘An insight on land use and land cover change due to tourism growth in coastal area and its environmental consequences from West Bengal, India’, Spatial Information Research, 29, pp. 577–592. https://doi.org/10.1007/s41324-020-00368-0
SCHIAVINA, M., MELCHIORRI, M., FREIRE, S., FLORIO, P., EHRLICH, D., TOMMASI, P. and KEMPER, T. (2022), ‘Land use efficiency of functional urban areas: Global pattern and evolution of development trajectories’, Habitat International, 123, 102543. https://doi.org/10.1016/j.habitatint.2022.102543
SHARPLEY, R. and HARRISON, D. (eds.). (2019), A research agenda for tourism and development, Edward Elgar Publishing
NUNNA, T. S. P. and BANERJEE, A. (2019), ‘Impact of tourism on spatial growth of the destination’, paper presented at the Proceedings of the Annual International Conference on Architecture and Civil Engineering, pp. 613–617. doi:10.5176/2301-394X_ACE19.610
UNITED NATIONS (2017), Global indicator framework for the Sustainable Development Goals and targets of the 2030 Agenda for Sustainable Development (A/RES/71/313).
UN-HABITAT (2018), ‘Metadata on SDGs Indicator 11.3.1 Indicator category: Tier II’, United Nations Human Settlement Program, Nairobi.
UN-HABITAT (2018), ‘SDG Indicator 11.3.1 Training Module: Land Use Efficiency’, United Nations Human Settlement Programme (UN-Habitat), Nairobi.
ZITTI, M., FERRARA, C., PERINI, L., CARLUCCI, M. and SALVATI, L. (2015), ‘Long-term urban growth and land use efficiency in Southern Europe: Implications for sustainable land management’, Sustainability, 7 (3), pp. 3359–3385. https://doi.org/10.3390/su7033359
|
|
|
|
|
|
|
|
|
|
|
|
|
|
|
|
|
|
|
|
|
|
|
|
|
|
|
|
|
|