Working Capital Management Strategy Effects on Firm Profitability and Risk: An Analysis of Polish Listed Construction Companies
Miłosz Michałowski
*

Summary: The article presents an analysis of working capital management strategies in the construction sector in Poland. The main objective of the study is to examine the impact of working capital management on the profitability and risk of firms operating in this sector. The study covered a group of public companies from 2019 to 2023. A synthetic indicator was developed to provide a comprehensive assessment of working capital management strategies, taking into account both financing and investment aspects. Based on the research, four basic working capital management strategies were identified and characterized, analyzing their impact on companies’ profitability and risk. Contrary to prevailing finance theory, the results indicate that in the construction sector, aggressive working capital management strategies negatively affect profitability while increasing operational risk. The study showed that the peculiarities of the construction sector, characterized by long project delivery cycles and significant capital intensity, require a more conservative approach to working capital management. The proposed methodology for evaluating working capital management strategies provides a useful tool to support decision-making in companies operating under increased market uncertainty.
Keywords: working capital management, profitability, construction sector, risk
JEL: G31, G32, G38, L79
Wpływ strategii zarządzania kapitałem obrotowym na rentowność i ryzyko firmy: na przykładzie publicznych spółek sektora budownictwa w Polsce
Streszczenie: W artykule przedstawiono analizę strategii zarządzania kapitałem obrotowym w sektorze budowlanym w Polsce. Głównym celem badania jest zidentyfikowanie wpływu zarządzania kapitałem obrotowym na rentowność i ryzyko firm działających w tym sektorze. Badaniem objęto grupę spółek publicznych w latach 2019–2023. Opracowano syntetyczny wskaźnik zapewniający kompleksową ocenę strategii zarządzania kapitałem obrotowym, uwzględniający zarówno aspekty finansowe, jak i inwestycyjne. Na podstawie badań zidentyfikowano i scharakteryzowano cztery podstawowe strategie zarządzania kapitałem obrotowym, analizując ich wpływ na rentowność i ryzyko spółek. W przeciwieństwie do dominującej teorii finansów, wyniki wskazują, że w sektorze budowlanym agresywne strategie zarządzania kapitałem obrotowym negatywnie wpływają na rentowność, jednocześnie zwiększając ryzyko operacyjne. Badanie wykazało, że specyfika sektora budowlanego, charakteryzująca się długimi cyklami realizacji projektów i znaczną kapitałochłonnością, wymaga bardziej konserwatywnego podejścia do zarządzania kapitałem obrotowym. Zaproponowana metodologia oceny strategii zarządzania kapitałem obrotowym stanowi użyteczne narzędzie wspierające podejmowanie decyzji w firmach działających w warunkach zwiększonej niepewności rynkowej.
Słowa kluczowe: zarządzanie kapitałem obrotowym, rentowność, sektor budownictwa, ryzyko
Introduction
Modern corporate financial management emphasizes the key role of working capital as the foundation for ensuring liquidity and optimizing financial performance. In particular, events such as the global financial crisis of 2008 (Carbo-Valverde et al., 2013) and the global COVID-19 pandemic (Lilas Demmou et al., 2021; Zimon and Tarighi, 2021) are a reminder that sustained shareholder value growth is built in an environment of full liquidity (Baker et al., 2023). This liquidity can be secured by an appropriate working capital management policy. The right strategy is one that maximizes the trade-off between profitability and risk (Van Horne and Wachowicz, 2009). Net working capital is defined as the difference between two aggregate balance sheet items, current assets and current liabilities (Sagner, 2014). However, beyond this accounting identity, net working capital can also be understood from a broader financial management perspective. As noted by Zietlow (2020), “short-term financial management refers to the utilization of the firm’s current assets and liabilities to maximize shareholder wealth,” with working capital encompassing cash and equivalents, accounts receivable, inventory, accounts payable, and accruals. These components, when grouped functionally, represent short-term operating and financial decisions that impact a firm’s liquidity and operational continuity. In this context, working capital is not just a residual from the balance sheet, but a dynamic concept involving both investment and financing decisions. It includes both the assets committed to day-to-day operations and the liabilities used to finance them. Therefore, in this study, we focus separately on the two sides of working capital management: investment in current assets and financing via current liabilities. We will refer to current asset management as the investment strategy and short-term liability management as the financing strategy. The A1 variable corresponds to the degree of investment in current assets, while A2 captures the approach to financing these assets using short-term liabilities. While the terminology “financing of working capital” might seem ambiguous, it is consistent with the view that managing the composition and maturity of short-term liabilities is an essential part of the working capital strategy. The combined interaction of these two approaches will be referred to throughout the article as the working capital management strategy.
The Polish construction sector is a major component of Poland’s GDP. In 2022, it reached a 10% share of the total national product and employs 6-8% of all employees in the Polish economy (The Polish Investment & Trade Agency, 2023). The construction sector is characterized by long project delivery cycles, significant dependence on external financing and a high risk of payment delays (Leśniak and Plebankiewicz, 2010). Under such conditions, working capital management becomes a key strategic challenge. Effective liquidity management not only enables companies to survive in a competitive market, but also contributes to improving their profitability (Sierpińska and Wędzki, 2017). On the other hand, wrong decisions in working capital management strategies can lead to a significant increase in operational risk and, in extreme cases, to bankruptcy (Hanlon et al., 2020).
Despite the wide range of literature on working capital management, there is still a need for empirical verification of the assumptions of classical theories regarding the impact of particular strategies on firm’s profitability and risk. These theories suggest that aggressive strategies, which involve minimizing the level of net working capital, should lead to higher profitability while increasing risk, while conservative strategies (in our case referred to as defensive), which involve maintaining higher liquidity reserves, may reduce risk at the expense of lower profitability (Brigham and Houston, 2022; Neveu, 1989; Preve and Sarria-Allende, 2010; Sierpińska and Wędzki, 2017; Van Horne and Wachowicz, 2009). The aim of this article is to test whether these classical assumptions are confirmed by actual data on the Polish construction sector.
1. Literature review
The management of working capital has been a focal point of financial research for last decade, with numerous studies investigating its impact on corporate performance. A significant body of research underscores the critical role of working capital management in enhancing firm profitability. Ali and Ali (2012) demonstrate that effective working capital decisions positively influence organizational profitability by balancing liquidity and operational efficiency. Similarly, Raheman and Nasr (2007) find a strong negative relationship between the cash conversion cycle (a core working capital metric) and profitability in Pakistani firms, suggesting that shorter cycles enhance profitability. This aligns with findings from Deloof (2003), who shows that reducing days accounts receivable and inventory levels improves profitability for Belgian firms. For SMEs, Martínez-Solano and García-Teruel (2007) report similar benefits, as shorter cash conversion cycles and reduced inventory improve profitability in Spanish companies. These findings are confirmed by Makori and Jagongo (2013), who emphasize that both receivables and inventory management directly affect profitability, though the relationship with days payable is nuanced. Recent studies further reinforce these conclusions. For instance, Aldubhani et al. (2022) find that shorter cash conversion cycles and faster receivables collection enhance profitability across several metrics (ROA, ROE), while Amponsah-Kwatiah and Asiamah (2020) confirm that efficient inventory, receivables, and payables management supports firm performance in Ghana’s manufacturing sector. Similar effects are noted by Thiago Alvarez et al. (2021) for Argentinian SMEs and by Sidra Tahir and Baloch (2023) for Pakistani manufacturing firms.
The choice of working capital management strategy significantly impacts firm outcomes. Korent and Orsag (2018) illustrate a concave relationship between net working capital and profitability, identifying an optimal level that maximizes returns. However, deviations from this level, either toward aggressive or conservative strategies, decrease profitability. Maswadeh (2015) finds that moderate strategies yield higher profitability compared to aggressive ones, while conservative approaches are rarely employed. Le (2019) highlights the trade-offs involved in working capital management, noting a negative relationship between net working capital and firm valuation, profitability, and risk. This trade-off underscores the strategic importance of managing liquidity and financial flexibility, especially for firms with limited capital access or during economic recoveries. This perspective is echoed in the findings of Akgün and Karataş (2020), who emphasize that elevated working capital levels negatively affect profitability, particularly in civil law countries and during crisis periods like 2008. Lefebvre (2022) adds that post-IPO firms often adopt more conservative working capital strategies, especially smaller firms or those without debt, highlighting the nuanced strategic adjustments firms make in varying financial contexts.
Working capital strategies vary across industries and economic contexts. Mielcarz, Osiichuk, and Wnuczak (2018) examine Polish firms, finding that during recessions, more profitable firms adopt conservative strategies, accumulating precautionary cash reserves. In contrast, Zimon (2020) observes that Polish manufacturing and tourism companies tend to favor moderate-conservative strategies, while transport and trade companies employ moderate-aggressive approaches. The COVID-19 crisis has demonstrated that SMEs should build financial reserves and adopt more conservative management strategies, prioritizing financial security over profit maximization. Complementing these observations, Rey-Ares et al. (2021) identify an optimal (U-shaped) level of inventories and receivables in Spanish fish canning companies, while longer payables periods reduce profitability. Further, sector-specific insights, such as those from Mohanty et al. (2023), show that in volatile industries like automotive, firms optimizing inventory and receivables achieve superior returns. Similarly, Eladly (2021) shows that liquidity ratios strongly influence profitability and asset quality in Egypt’s insurance sector, though findings partly diverge from general industry patterns. Emerging research also highlights the role of digitalization in working capital efficiency. Gill et al. (2022) find that IT investments significantly shorten the cash conversion cycle and improve efficiency among Indian SMEs, particularly where owners are well-educated.
Despite the robust theoretical and empirical foundations, several gaps remain. Most studies focus on general manufacturing or service sectors, with limited attention to industry-specific dynamics, such as those in the construction sector. Furthermore, while the trade-offs between profitability and risk are well-documented, there is limited empirical evidence testing these relationships in the Polish corporate context. Additionally, the literature lacks comprehensive metrics for comparing working capital strategies across firms. This study addresses these gaps by introducing a novel, dual-perspective indicator that combines activity-based ratios (integrating income statement and balance sheet data) with balance-sheet-specific metrics (e.g., working-to-fixed capital ratio). The theoretical contribution lies in redefining working capital management strategies—traditionally viewed as qualitative and context-dependent—into a quantifiable framework, enhancing cross-firm comparability. Empirically, the proposed metric offers a practical tool for benchmarking companies not only within the Polish construction sector but also across industries and countries, thus bridging a critical gap in applied financial management. We will begin our analysis with the development of this indicator. Accordingly, the article seeks to answer the following research questions:
- Is it possible to develop a synthetic indicator to describe financing and working capital investment strategies?
- Do companies in the construction sector in Poland apply differentiated working capital management strategies?
- Does the chosen working capital management strategy significantly affect the profitability of the company?
- Does the chosen working capital management strategy significantly affect the company’s risk?
In addition, the analysis carried out will enable the verification of three research hypotheses:
H1: The construction sector is characterized by high homogeneity, resulting in companies pursuing similar financing and investment strategies.
H2: Aggressive working capital management strategies generate higher profitability than conservative strategies.
H3: Aggressive working capital management strategies are associated with higher risk than conservative strategies.
The proposed work not only fills a gap in the literature, but also provides practical guidance for managers and decision-makers in the construction sector, allowing them to better adapt working capital management strategies to the specific market conditions in Poland.
2. The methodology
Following the approach presented by Zabolotnyy and Sipilainen (2020), this study constructs two key indicators of working capital management strategies: A1, corresponding to investment in working capital, and A2, describing the financing of this capital. These indicators allow for a comprehensive analysis of the adopted strategies in relation to their aggressiveness or conservatism. Table 1 illustrates the set of variables with their abbreviations, formulas and assignment to the relevant indicators. An important observation is that the variety of variables captures both operational aspects, such as the efficiency of the use of current assets (e.g. CAT), and structural aspect (e.g. DE).
| Variable | Acronym | Equation | Group | Effect |
|---|---|---|---|---|
| X1 | CAT | Sales/Avg. Current Assets | A1 | Positive |
| X2 | PPET | Sales/Avg. PP&E | A1 | Negative |
| X3 | θC | Avg. CCE/Avg. Total Assets | A1 | Negative |
| X4 | CAFA | Avg. Current Assets/Avg. Fixed Assets | A1 | Negative |
| X5 | CLT | Sales/Avg. Current Liabilities | A2 | Negative |
| X6 | θCL | Avg. Current Liabilities/Avg. Total Assets | A2 | Positive |
| X7 | DE | Avg. Liabilities/Avg. Equity | A2 | Positive |
| X8 | SDCE | Avg. Current Liabilities/Avg. Capital Engaged | A2 | Positive |
Source: Own research based on: Zabolotnyy S., Sipiläinen T. (2020), A comparison of strategies for working capital management of listed food companies from Northern Europe, Agricultural and Food.
The variables described in Table 1 were used to construct the indicators, which are divided into groups according to their effect on each indicator. For variables whose growth promotes an aggressive strategy, their effect is positive, while for variables supporting a conservative strategy, their effect on the indicator is negative. For the following equations, indices n, c, and t denote the n-th variable, c-th company, and t-th period. In order to improve the quality of the aggregation and reduce the impact of potential outliers in the sample, the variables were normalized using the Z-Score. This process involves calculating the mean value and standard deviation for each variable in a given year, according to the formulas below:
(1)
(2)
The standardized ratios were calculated according to the formula:
(3)
The use of Z-Score normalization in studies of this type is crucial, as it allows variables of different scales and units to be compared, and the unification of variable values eliminates the impact of differences in their distributions, which is particularly important when analyzing a sample that may include companies with radically different financial and operational structures. An additional step was to use a hyperbolic tangent function to limit the values of the variables to the range [-1;1]:
(4)
This procedure not only improves the interpretation of the results, but also prevents excessive outliers from affecting the aggregation of the indicators. This method can be considered optimal, as it amplifies differences in values close to the mean, giving more weight to differences in values close to zero, thus making the subtle differences between moderate strategies more visible, while suppressing the influence of extreme values, which, although still included, have a limited impact on the value of the final indicator, thus increasing its stability. Finally, the strategy indicators A1 and A2 were calculated as the arithmetic mean of the values of the variables assigned to the group:
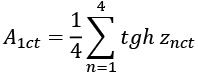
(5)
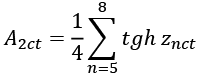
(6)
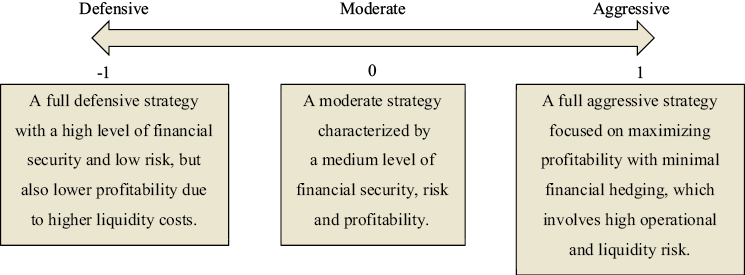
Figure 1 shows a one-dimensional individual interpretation of the working capital management indicator, where negative values (-1 to 0) indicate a conservative strategy characterized by a greater emphasis on stability and financial security, positive values (0 to 1) represent an aggressive approach aimed at maximizing profits, and values close to 0 reflect a moderate strategy balancing risk and stability.
Source: Own research.
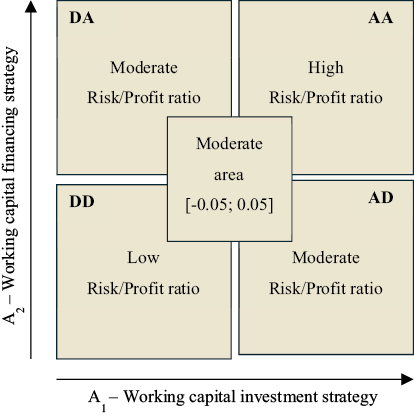
Figure 2 shows a two-dimensional interpretation of the working capital management strategy, where A1 and A2 are both visualized on the axes limited to the interval [-1;1]. The resulting matrix identifies four main strategic areas: DD (Defensive-Defensive) in the [A1 < -0,05 and A2 < -0,05] area characterized by risk minimization, DA (Defensive-Aggressive) in the [A1 < -0,05 and A2 > 0,05] area combining safe investments with risky financing, AD (Aggressive-Defensive) in the [A1 > 0,05 and A2 < -0,05] area indicating aggressive investments with conservative financing, and AA (Aggressive-Aggressive) in the [A1 > 0,05 and A2 > 0,05] area representing maximization of potential returns with high risk, with the space [-0.05; 0.05] for both indicators defines the area of moderate strategies.
To answer the research questions and test the hypotheses, a regression analysis was conducted. The impact of working capital management strategies on companies’ profitability and risk was examined. Profitability indicators were operating margin, return on sales and return on equity, while risk was measured by the current liquidity ratio. The variables included in the regression models are detailed in Table 2, along with the corresponding formulas.
Source: Own research.
Formula (7) includes working capital management strategy indicators A1 and A2, a synergy variable (δ = A1 * A2) which makes it possible to recognize whether there is an additional effect of adopting two of the same strategies and a counter-effect of adopting opposite ones. We also include company size (SIZE) and gross margin (GM) to capture the impact of scale of operations and cost efficiency.

(7)

(8)

(9)
| Variable | Description | Equation |
|---|---|---|
| GM | Gross margin | 1 – COGS/Sales |
| OM | Operating margin | EBIT/Sales |
| ROS | Return on sales | Net Income/Sales |
| ROE | Return on equity | Net Income/Avg. Equity |
| CR | Current ratio | Avg. Current Assets/Avg. Current Liabilities |
| ICR | Interest coverage ratio | EBIT/Interest |
| δ | Synergy factor | A1∗A2 |
| SIZE | Company size | ln(Avg. Total Assets) |
| g | Sales growth | Salest/Salest−1 – 1 |
| rd | Cost of debt | Interest/Avg. Debt |
Source: Own research.
Formula (8) additionally considers the cost of debt (rd), examining how financing strategies interact with profitability of sales. Formula (9) extends the analysis to include sales growth rate (g), highlighting the importance of expansion in increasing ROE.

(10)
Formula (10) relates to risk, as measured by the liquidity ratio (CR), and takes into account the interest coverage ratio (ICR), which indicates the firm’s ability to service its interest obligations, highlighting the key impact of financial strategies on liquidity stability.
For the purpose of the analysis, 33 companies from the construction sector, listed on the Warsaw Stock Exchange and the NewConnect market, were selected, covering the period from 2019 to 2023. The sample was restricted to companies with positive equity only, excluding entities with negative equity to ensure consistency and reliability of the results. The data used in the study was obtained from the EMIS database, which provides detailed financial and operational information on companies.
3. Results
In response to the first research question concerning the possibility of developing a synthetic indicator describing financing and working capital investment strategies, the results of the research confirm that it has been possible to successfully create such a measure.
| no data | A1 | no data | A2 | ||||||||
|---|---|---|---|---|---|---|---|---|---|---|---|
| Firm | 2020 | 2021 | 2022 | 2023 | Mean | no data | 2020 | 2021 | 2022 | 2023 | Mean |
| 1AT | -0.55 | -0.62 | -0.70 | -0.72 | -0.65 | no data | -0.11 | -0.09 | -0.13 | -0.25 | -0.15 |
| ATR | 0.66 | 0.41 | 0.39 | 0.31 | 0.44 | no data | 0.23 | 0.29 | 0.26 | 0.19 | 0.24 |
| BDX | -0.29 | -0.14 | -0.17 | -0.19 | -0.20 | no data | 0.78 | 0.79 | 0.80 | 0.80 | 0.79 |
| DEK | -0.11 | 0.01 | -0.06 | -0.11 | -0.07 | no data | 0.21 | 0.26 | 0.15 | -0.08 | 0.13 |
| DOM | -0.77 | -0.76 | -0.68 | -0.56 | -0.69 | no data | 0.15 | 0.31 | 0.40 | 0.34 | 0.30 |
| ELT | 0.36 | 0.38 | -0.26 | -0.21 | 0.07 | no data | -0.05 | -0.01 | -0.01 | 0.04 | -0.01 |
| ENI | 0.51 | 0.59 | 0.73 | 0.60 | 0.61 | no data | -0.60 | -0.34 | -0.08 | 0.00 | -0.26 |
| ENP | 0.44 | -0.08 | 0.06 | -0.18 | 0.06 | no data | -0.58 | -0.73 | -0.75 | -0.60 | -0.66 |
| ERB | -0.06 | -0.11 | 0.12 | 0.37 | 0.08 | no data | 0.28 | 0.08 | -0.04 | 0.08 | 0.10 |
| HMI | 0.06 | 0.01 | -0.07 | -0.33 | -0.08 | no data | 0.64 | 0.43 | 0.70 | 0.28 | 0.51 |
| HRS | 0.41 | 0.44 | 0.53 | 0.70 | 0.52 | no data | -0.28 | -0.19 | -0.14 | 0.00 | -0.15 |
| INK | 0.08 | 0.12 | 0.22 | 0.18 | 0.15 | no data | -0.74 | -0.74 | -0.76 | -0.62 | -0.72 |
| INP | -0.10 | -0.03 | 0.02 | 0.08 | -0.01 | no data | -0.26 | -0.29 | -0.42 | -0.41 | -0.34 |
| MCR | 0.60 | 0.58 | 0.58 | 0.67 | 0.61 | no data | -0.67 | -0.63 | -0.68 | -0.73 | -0.68 |
| MDI | -0.72 | -0.35 | -0.20 | -0.09 | -0.34 | no data | 0.37 | 0.58 | 0.70 | 0.70 | 0.59 |
| MRB | 0.04 | -0.12 | 0.01 | 0.22 | 0.04 | no data | -0.48 | -0.43 | -0.33 | -0.30 | -0.38 |
| MSP | 0.36 | -0.15 | 0.16 | 0.36 | 0.18 | no data | 0.43 | 0.42 | -0.07 | -0.03 | 0.19 |
| MSW | -0.47 | -0.23 | -0.22 | -0.02 | -0.24 | no data | 0.90 | 0.90 | 0.84 | 0.84 | 0.87 |
| NVA | 0.53 | 0.26 | 0.24 | 0.24 | 0.32 | no data | -0.33 | -0.41 | -0.34 | -0.39 | -0.37 |
| PBX | 0.28 | 0.39 | 0.49 | 0.41 | 0.39 | no data | -0.43 | -0.22 | 0.01 | 0.12 | -0.13 |
| PJP | 0.46 | 0.61 | 0.29 | 0.49 | 0.46 | no data | -0.43 | -0.03 | -0.07 | 0.01 | -0.13 |
| PRM | 0.14 | 0.42 | 0.26 | 0.20 | 0.26 | no data | -0.46 | -0.22 | -0.26 | -0.58 | -0.38 |
| PXM | 0.04 | -0.14 | -0.15 | 0.19 | -0.01 | no data | -0.06 | 0.07 | 0.02 | 0.13 | 0.04 |
| QRT | -0.29 | -0.09 | 0.01 | -0.07 | -0.11 | no data | -0.29 | -0.89 | -0.91 | -0.91 | -0.75 |
| RMK | -0.07 | -0.13 | -0.05 | 0.02 | -0.06 | no data | 0.67 | 0.62 | 0.15 | 0.02 | 0.37 |
| STX | -0.24 | -0.22 | -0.12 | -0.23 | -0.20 | no data | -0.41 | -0.46 | -0.43 | -0.36 | -0.42 |
| TME | 0.24 | 0.45 | 0.57 | 0.50 | 0.44 | no data | -0.37 | -0.50 | -0.60 | -0.13 | -0.40 |
| TOR | -0.18 | 0.00 | -0.14 | -0.24 | -0.14 | no data | 0.68 | 0.54 | 0.24 | -0.02 | 0.36 |
| TOS | 0.22 | 0.24 | -0.01 | -0.13 | 0.08 | no data | -0.31 | -0.23 | -0.30 | -0.37 | -0.30 |
| TRK | 0.34 | 0.39 | 0.41 | 0.18 | 0.33 | no data | 0.31 | 0.37 | 0.78 | 0.86 | 0.58 |
| TSG | 0.66 | 0.44 | 0.42 | 0.37 | 0.47 | no data | -0.77 | -0.65 | -0.65 | -0.78 | -0.71 |
| UNI | 0.00 | 0.06 | 0.04 | 0.12 | 0.06 | no data | 0.14 | 0.41 | 0.59 | 0.71 | 0.46 |
| ZUE | 0.53 | 0.46 | 0.33 | -0.04 | 0.32 | no data | 0.19 | 0.37 | 0.53 | 0.51 | 0.40 |
Source: Own research.
The developed A1 and A2 indicators show an equilibrium character, which means that their interpretation is strictly dependent on the context of the analysis – both with regard to the research sample and the reference point. The values of the indicators are consistent with the strategic assumptions made and reflect the specifics of working capital management in the companies analyzed. Importantly, this indicator can serve as a flexible analytical tool, allowing comparisons both within a single sector and between different industries.
| Investing | no data | Financing | no data | Combination | ||||||||||||
|---|---|---|---|---|---|---|---|---|---|---|---|---|---|---|---|---|
| D | M | A | no data | D | M | A | no data | DD | DM | DA | MD | MM | MA | AD | AM | AA |
| 11 | 3 | 19 | no data | 17 | 2 | 14 | no data | 3 | 0 | 8 | 2 | 1 | 0 | 12 | 1 | 6 |
Source: Own research.
.png)
Source: Own research.
Analyzing the second research question relating to the diversity of working capital management strategies in the Polish construction sector, the empirical data indicates a significant diversity of approaches adopted. The analysis of the data in the Table 3 and 4 shows that companies use different combinations of strategies, with the most common ones being an aggressive strategy in investing combined with a defensive strategy in financing (AD) – used by 12 companies, and a defensive strategy in investing with an aggressive strategy in financing (DA) – found in eight cases. Less popular is the combination of two aggressive strategies (AA), which was identified in six entities. With regard to hypothesis H1, assuming homogeneity of the construction sector in terms of the financing and investment strategies pursued, it was rejected. The analysis of the empirical data presented in the table clearly shows the existence of diverse combinations of strategies. Particularly evident is the tendency to avoid using identical strategies in the area of financing and investment, which may reflect a conscious effort to nullify synergies. The values of indicators A1 and A2 for individual companies (3) confirm the lack of a uniform approach to working capital management in the sector studied. Based on the descriptive statistics presented in Table 5, it can be seen that the companies studied are characterized by a moderate level of profitability, with an average ROE of 8.2% and an average operating margin of 6.6%. At the same time, significant variation is observed in terms of the working capital management strategies used, confirming the earlier conclusions about the heterogeneity of the sector in this respect.
| Variable | Mean | SE | Median | σ | Min | Max |
|---|---|---|---|---|---|---|
| 1. Working capital management strategies indicators | ||||||
| 1a. A1 | 0.094 | 0.030 | 0.062 | 0.348 | -0.768 | 0.727 |
| 1b. A2 | -0.030 | 0.042 | -0.044 | 0.478 | -0.913 | 0.904 |
| 1c. δ | -0.054 | 0.012 | -0.017 | 0.141 | -0.506 | 0.317 |
| 2. Profitability and risk indicators | ||||||
| 2a. GM | 0.138 | 0.012 | 0.129 | 0.143 | -0.428 | 0.668 |
| 2b. OM | 0.066 | 0.009 | 0.060 | 0.103 | -0.354 | 0.348 |
| 2c. ROS | 0.035 | 0.010 | 0.040 | 0.113 | -0.565 | 0.317 |
| 2d. ROE | 0.082 | 0.022 | 0.112 | 0.252 | -1.289 | 0.572 |
| 2e. CR | 1.921 | 0.204 | 1.426 | 2.348 | 0.604 | 20.059 |
| 3. Control indicators | ||||||
| 3a. SIZE | 12.917 | 0.138 | 13.008 | 1.583 | 8.347 | 15.883 |
| 3b. g | 0.114 | 0.030 | 0.067 | 0.340 | -0.602 | 1.757 |
| 3c. rd | 0.078 | 0.007 | 0.061 | 0.082 | -0.041 | 0.662 |
Source: Own research.
Referencing to the third research question concerning the impact of working capital management strategies on company profitability, the empirical research conducted provides clear evidence of a significant relationship. The analysis of the three regression models (M1, M2, M3) showed that the selected working capital management strategies have a mostly equal impact on the different measures of company profitability. The M1 model, explaining the variation in OM, has a very high level fit and is statistically significant. The results indicate that both the investment strategy (A1) and the financing strategy (A2) have a negative impact on the operating margin, with the impact of the investment strategy being significantly stronger (coefficient -0.069) than that of the financing strategy (-0.022). It is worth noting that GM proved to be the strongest predictor of operating margin with a positive coefficient of 0.548.
Similar relationships were observed in model M2, which analyses the impact of strategies on ROS. The model also has a high level of fit and confirms the negative impact of aggressive strategies, with a stronger impact of investment strategies (coefficient -0.084) compared to financing strategies (-0.025).
| no data | Model 1 | no data | Model 2 | no data | Model 3 | ||||||
|---|---|---|---|---|---|---|---|---|---|---|---|
| VAR | Coeff. | t | p | no data | Coeff. | t | p | no data | Coeff. | t | p |
| C | -0.059 | -1.597 | 0.113 | no data | 0.010 | 1.109 | 0.270 | no data | 0.001 | 0.020 | 0.984 |
| A1 | -0.069** | -5.469 | 0.000 | no data | -0.084** | -5.692 | 0.000 | no data | -0.116* | -2.005 | 0.047 |
| A2 | -0.022* | -2.179 | 0.031 | no data | -0.025* | -2.385 | 0.019 | no data | 0.081* | 1.984 | 0.049 |
| δ | 0.022 | 0.792 | 0.430 | no data | 0.026 | 0.815 | 0.416 | no data | -0.377** | -3.067 | 0.003 |
| SIZE | 0.004 | 1.474 | 0.143 | no data | no data | no data | no data | no data | no data | no data | no data |
| GM | 0.548** | 16.870 | 0.000 | no data | 0.503** | 14.241 | 0.000 | no data | 0.723** | 5.356 | 0.000 |
| rd | no data | no data | no data | no data | -0.451** | -8.217 | 0.000 | no data | -0.579** | -2.759 | 0.007 |
| g | no data | no data | no data | no data | no data | no data | no data | no data | 0.172** | 3.341 | 0.001 |
| R2 | 0.833 | no data | 0.811 | no data | 0.452 | ||||||
| Adj. R2 | 0.826 | no data | 0.804 | no data | 0.425 | ||||||
| F-stat | 125.545 | no data | 108.162 | no data | 17.167 | ||||||
| D-W | 2.019 | no data | 2.232 | no data | 2.164 | ||||||
| M1 |  |
||||||||||
| M2 |  |
||||||||||
| M3 |  |
||||||||||
Note: ** p < 0,01; * p < 0,05.
Source: Own research.
The cost of debt also plays an important role in this model, showing a significant negative impact on return on sales (-0.451). The M3 model, focusing on ROE, presents slightly different results. With a lower but still satisfactory level of fit, the model shows an interesting dichotomy: while an aggressive investment strategy still has a negative impact (-0.116), an aggressive financing strategy has a positive impact on ROE (0.081). This positive relationship may be due to the leverage effect and the mechanical reduction of the ROE denominator. In light of the above results, hypothesis H2, which assumes that aggressive working capital management strategies generate higher profitability than conservative strategies, was rejected. The empirical data indicates that, in most cases, an aggressive approach to working capital management leads to lower profitability. The only exception is the positive effect of an aggressive financing strategy on ROE, which, however, may be more related to the mechanism of the indicator than to actual improvements in operational efficiency.
| no data | Model 4 | ||
|---|---|---|---|
| VAR | Coeff. | t | p |
| C | 6.628** | 4.110 | 0.000 |
| A1 | -1.450* | -2.394 | 0.018 |
| A2 | -1.732** | -2.179 | 0.000 |
| δ | 2.481* | 1.984 | 0.049 |
| SIZE | -0.376** | -3.066 | 0.003 |
| ICR | 0.028** | 2.947 | 0.000 |
| R2 | 0.334 | ||
| Adj. R2 | 0.308 | ||
| F-stat | 12.660 | ||
| D-W | 2.016 | ||
| M4 |  |
||
Note: ** p < 0,01; * p < 0,05.
Source: Own research.
Focusing on the fourth research question, concerning the impact of working capital management strategies on company risk, the empirical analysis conducted provides convincing evidence of a significant relationship. The M4 model, investigating the effect of strategy on the CR, shows a moderate fit and is statistically significant. The results indicate that both the aggressive investment strategy (A1) and the funding strategy (A2) have a significant negative impact on the current liquidity ratio, with coefficients of -1.450 and -1.732, respectively. A particularly interesting finding is the δ between strategies, which partially mitigates the increase in liquidity risk (coefficient 2.481). Referring to the regression results, hypothesis H3, which assumes that aggressive working capital management strategies are associated with higher risk than conservative strategies, is confirmed. The model also reveals the important role of control variables – company size shows a negative effect on the liquidity ratio (-0.376), suggesting that larger companies can afford a higher level of risk due to better access to external financing. At the same time, the ICR has a weak but positive impact on liquidity (0.028), indicating that companies with lower debt levels have lower liquidity risk. It is worth noting that the average current ratio in the sample is 1.921 (Table 5), indicating a relatively safe level of liquidity in the sector.
Conclusions
The results of the study indicate an interesting divergence from the dominant strand of working capital management theory. While a significant body of literature, including studies by Singh et al. (2017), Nazir and Afza (2009) and Deloof (2003), indicates a positive relationship between aggressive strategies and profitability, our study found different results in the construction sector. We observed that an aggressive approach to working capital management negatively affects firms’ profitability, while confirming the traditional assumption of higher risk associated with such strategies, which is supported by the work of Akbar et al. (2021), Wieczorek-Kosmala et al. (2016) and Al-Shubiri (2011). The results obtained can be explained by the peculiarities of the construction sector and the macroeconomic conditions of the research period. As demonstrated by Mielcarz et al. (2018), during periods of increased economic uncertainty, more profitable firms often adopt conservative working capital management strategies. This is particularly relevant in the context of the construction sector, where the implementation of projects requires significant financial outlays over a long period of time before there is a return in the form of revenues. Our findings correspond with studies by Zeidan and Vanzin (2019) and Ng et al. (2017), who observed that firms with longer cash conversion cycles often achieve higher operating margins, despite theoretically less efficient working capital management. High levels of uncertainty in the macro-environment, including supply chain disruptions and the economic downturn, have particularly affected the construction industry. Firms aggressively managing working capital may have been more vulnerable to liquidity problems, as evidenced in studies by Yang and Birge (2017) and Kieschnick et al. (2012). In this context, more conservative working capital management strategies, based on maintaining higher cash reserves and greater financial stability, were found to be more effective in protecting profitability, which is consistent with the findings of Maswadeh (2015) and Vishnani and Shah (2007). Our recommendations for business practice are based on several key findings. First, as observed by Zimon (2020) and Zabolotnyy and Wasilewski (2019), construction firms should adopt a more defensive approach to working capital management that increases liquidity and minimizes risk. Second, as suggested by Makori and Jagongo (2013) and Raheman and Nasr (2007), firms should focus on optimizing individual working capital components, tailoring strategies to sector-specific and macroeconomic conditions. Finally, our study indicates that theories from academic textbooks are often one-size-fits-all and do not take into account the specificities of individual sectors, as confirmed by the work of Nuhiu and Dermaku (2017) and Talonpoika et al. (2016).
Moreover, the implications of our findings extend beyond the construction sector and are relevant to all industries characterized by long project realization cycles. In periods of heightened uncertainty or when there is a significant risk of payment bottlenecks in the economy, managers should strongly consider adopting more conservative policies regarding both financing and investment decisions. Our analysis shows that any potential gains from aggressive approaches are overwhelmingly offset by losses once a ‟black swan” event occurs. Construction halts, combined with difficulties in debt rollover, proved far more damaging than any short-term profitability improvements. Therefore, the strategic stance of firms operating in uncertainty-prone sectors should prioritize resilience and liquidity over theoretical efficiency gains. The study is limited to public construction firms in Poland and a specific economic period. Future research could test the robustness of these findings in other sectors or countries.
Autorzy
* Miłosz Michałowski
References
Akbar, A., Akbar, M., Nazir, M., Poulova, P., Ray, S. (2021), Does Working Capital Management Influence Operating and Market Risk of Firms?, Risks 9, 201.
Akgün, A.İ., Karataş, A.M. (2020), Investigating the relationship between working capital management and business performance: evidence from the 2008 financial crisis of EU-28, International Journal of Managerial Finance 17, 545–567.
Aldubhani, M.A.Q., Wang, J., Gong, T., Maudhah, R.A. (2022), Impact of working capital management on profitability: evidence from listed companies in Qatar, Journal of Money and Business 2, 70–81.
Ali, A., Ali, S.A. (2012), Working Capital Management: Is It Really Affects the Profitability? Evidence from Pakistan. Global Journal of Management and Business Research.
ALShubiri, F.N. (2011), The Effect of Working Capital Practices on Risk Management: Evidence from Jordan. Global Journal of Business Research.
Alvarez, T., Sensini, L., Vazquez, M. (2021), Working Capital Management and Profitability: Evidence from an Emergent Economy, International Journal of Advances in Management and Economics, 32–39.
Amponsah-Kwatiah, K., Asiamah, M. (2020), Working capital management and profitability of listed manufacturing firms in Ghana, International Journal of Productivity and Performance Management 70, 1751–1771.
Baker, H.K., Filbeck, G., Barkley, T. (2023), Working capital management: concepts and strategies. World Scientific Publishing Co. Pte. Ltd., Singapore.
Brigham, E.F., Houston, J.F. (2022), Fundamentals of financial management, 16e ed. Cengage Learning, Boston, MA.
Carbo-Valverde, S., Rodriguez-Fernandez, F., Udell, G.F. (2013), Trade Credit, the Financial Crisis, and SME Access to Finance. Journal of Money, Credit and Banking.
Deloof, M. (2003), Does Working Capital Management Affect Profitability of Belgian Firms?, Journal of Business Finance & Accounting 30, 573–588.
Demmou, L., Franco, G., Calligaris, S., Dlugosch, D. (2021), Liquidity shortfalls during the COVID-19 outbreak: Assessment and policy responses, OECD Economics Department Working Papers 1647.
Eladly, S.M. (2021), Working Capital Management on Profitability and Earning Assets of Insurance Industry in Egypt, International Journal of Business and Management 16, 17.
Gill, A., Kang, P., Amiraslany, A. (2022), Information technology investment and working capital management efficiency: evidence from India survey data, South Asian Journal of Business Studies 12, 559–574.
Hanlon, M.L., Magee, R.P., Pfeiffer, G.M., Dyckman, T.R. (2020), Financial accounting, Sixth edition, student edition. ed. Cambridge Business Publishers, Westmont, Illinois.
Juan García‐Teruel, P., Martínez‐Solano, P. (2007), Effects of working capital management on SME profitability, International Journal of Managerial Finance 3, 164–177.
Kieschnick, R.L., Laplante, M., Moussawi, R. (2012), Working Capital Management and Shareholder Wealth, Review of Finance 17, 1827–1852.
Korent, D., Orsag, S. (2018), The Impact of Working Capital Management on Profitability of Croatian Software Companies. Zagreb International Review of Economics and Business 21, 47–66.
Le, B. (2019), Working capital management and firm’s valuation, profitability and risk: Evidence from a developing market, International Journal of Managerial Finance 15, 191–204.
Lefebvre, V. (2022), Working capital management of IPO firms, Managerial Finance 49, 808–828.
Leśniak, A., Plebankiewicz, E. (2010), Opóźnienia w robotach budowlanych. Zeszyty Naukowe / Wyższa Szkoła Oficerska Wojsk Lądowych im. gen. T. Kościuszki nr 3, 332–339.
Makori, D.M., Jagongo, A.O. (2013), Working Capital Management and Firm Profitability: Empirical Evidence from Manufacturing and Construction Firms Listed on Nairobi Securities Exchange, Kenya, International Journal of Accounting and Taxation.
Maswadeh, S.N. (2015), Association between Working Capital Management Strategies and Profitability, International Journal of Accounting and Financial Reporting 5, 91–98.
Mielcarz, P., Osiichuk, D., Wnuczak, P. (2018), Working Capital Management through the Business Cycle: Evidence from the Corporate Sector in Poland, Contemporary Economics 12, 223–236.
Mohanty, A., Venkateswaran, N., Ranjit, P.S., Tripathi, M.A., Boopathi, S. (2023), Innovative Strategy for Profitable Automobile Industries: Working Capital Management, in: Ramakrishna, Y., Wahab, S.N. (eds.), Advances in Finance, Accounting, and Economics, IGI Global, 412–428.
Nazir, M.S., Afza, T. (2009), Impact of Aggressive Working Capital Management Policy on Firms’ Profitability, The IUP Journal of Applied Finance 15(8):19–30.
Neveu, R.P. (1989), Fundamentals of managerial finance, 3rd ed. ed. South-Western Pub. Co., Cincinnati.
Ng, S., Ye, C., Ong, T.S., Teh, B.H. (2017), The Impact of Working Capital Management on Firm’s Profitability: Evidence from Malaysian Listed Manufacturing Firms, IJEFI 7, 662–670.
Nuhiu, A., Dermaku, A. (2017), A Theoretical Review on the Relationship between Working Capital Management and Company’s Performance. Acta Universitatis Danubius. Œconomica 13.
Preve, L.A., Sarria-Allende, V. (2010), Working capital management, Financial Management Association survey and synthesis series, Oxford University Press, New York.
Raheman, A., Nasr, M. (2007), Working capital management and profitability-case of Pakistani Firms. Presented at the International Review of Business Research Papers, 279–300.
Rey-Ares, L., Fernández-López, S., Rodeiro-Pazos, D. (2021), Impact of working capital management on profitability for Spanish fish canning companies, Marine Policy 130, 104583.
Sagner, J. (2014), Working Capital Management: Applications and Case Studies, Wiley, Hoboken.
Sierpińska, M., Wędzki, D. (2017), Zarządzanie płynnością finansową w przedsiębiorstwie, Wyd. 1, 11 dodr. ed, FFF - Wydawnictwo Naukowe PWN. Wydawnictwo Naukowe PWN, Warszawa.
Singh, S., Kaur, H. (2017). Working Capital Management and Profitability: Evidence from Selected Steel Manufacturing Companies in India, Indian Journal of Commerce and Management Studies 8, 73–79.
Tahir, S., Baloch, S. (2023), Role of Working Capital Management in Enhancing Firm Profitability: An Empirical Study on the Manufacturing Companies of Pakistan, Journal of Economic Impact 5, 231–237.
Talonpoika, A.-M., Kärri, T., Pirttilä, M., Monto, S. (2016), Defined strategies for financial working capital management, International Journal of Managerial Finance 12, 277–294.
The Polish Investment & Trade Agency (2023). The construction sector, https://www.paih.gov.pl/wp-content/uploads/2024/02/The-Construction-Sector-2023.pdf, (accessed: 5.01.2025).
Van Horne, J.C., Wachowicz, J.M. (2009). Fundamentals of financial management, 13th edition. ed. Financial Times Prentice Hall, Harlow.
Vishnani, S., Shah, B.Kr. (2007). Impact of Working Capital Management Policies on Corporate Performance—An Empirical Study, Global Business Review 8, 267–281.
Wieczorek-Kosmala, M., Doś, A., Błach, J., Gorczyńska, M. (2016). Working capital management and liquidity reserves: The context of risk retention. Journal of Economics and Management 23, 5–20.
Yang, S.A., Birge, J.R. (2017), Trade Credit, Risk Sharing, and Inventory Financing Portfolios. Management Science 64(8):3667-3689.
Zabolotnyy, S., Wasilewski, M. (2019), The Concept of Financial Sustainability Measurement: A Case of Food Companies from Northern Europe, Sustainability 11, 5139.
Zabolotnyy, S., Sipiläinen, T. (2020). A comparison of strategies for working capital management of listed food companies from Northern Europe, Agricultural and Food Science 29, 239–249.
Zeidan, R., Vanzin, C. (2019), Gestão do ciclo financeiro, rentabilidade e restrições financeiras, Brazilian Review of Finance 17, 77–90.
Zietlow, J.T., Hill, M., Maness, T.S. (2020), Short-term financial management, Newly revised fifth edition, Cognella Academic Publishing, San Diego.
Zimon, G. (2020). Working Capital Management Strategies in Polish SMEs, Academy of Accounting and Financial Studies Journal 24.
Zimon, G., Tarighi, H. (2021). Effects of the COVID-19 Global Crisis on the Working Capital Management Policy: Evidence from Poland. Journal of Risk and Financial Management 14, 169.