Bogna Kaźmierska-Jóźwiak
Nicolene Wesson
Gretha Steenkamp
Share repurchases versus dividends: A comparison between Poland and South Africa
Summary
The main aim of the study is to compare share repurchase and dividend payout trends of listed non-financial and non-resource companies in Poland and South Africa over the period 2005–2015. Although South Africa is a developing country with a dualistic economy, the country is characterized by a sophisticated stock exchange which is comparable to that of most advanced economies, while Poland was reclassified from emerging market to developed market status, effective as from 24 September 2018. Comparative analysis provides insights on the regulatory differences and the effect therefore on share repurchase and dividend behaviour, and whether these countries mirror the excessive payout behaviour observed in the United States of America (US). The study results show that in both countries dividends are the dominant form of payouts to shareholders. Moreover, none of the examined countries mirrors the excessive payout behaviour observed in the US – neither in Poland, nor in South Africa did share repurchases surpass dividends. Regulatory differences between Poland and South Africa, however, affected the observed trends in payout behaviour between these two countries.
Keywords: dividend, share repurchase, payout policy, Poland, South Africa
JEL: G35, M2
Introduction
When a company has excess capital resources, it can invest funds to advance business goals or return the cash to claim holders (as dividends, debt repayments or share repurchases). Dividends were the only available method of distributing excess cash to shareholders prior to the introduction of share repurchases. Although the choice between share repurchases and dividends in many circumstances is determined by the motivation for the distribution, share repurchases are in general seen as a more flexible distribution method. The United States of America (US) was the first country to legalise share repurchases, where they were popular as from 1980, whilst the United Kingdom (UK) legalised share repurchases in 1981 and most other jurisdictions allowed share repurchases as from the 1990s (Wesson 2015, pp. 43–54). The highest value of share repurchases are reported in the US, where share repurchases for non-financial companies have surpassed dividends as from 2005. Despite a temporary reduction in share repurchases during the 2008/2009 financial crisis, the post-2009 US levels again exceeded pre-recession levels and record amounts were reported since 2013 (Barnes 2015, pp. 25–36). For the period 2003–2013, the S&P 500 companies on average paid out 91% of their profits through dividends (37%) and share repurchases (54%), leaving little room for investments in future growth (Lazonick 2014, pp. 46–55).
The present study aims to compare share repurchase and dividend payout trends of listed non-financial and non-resource companies in Poland and South Africa. Although South Africa is a developing country with a dualistic economy, it is characterized by a sophisticated stock exchange (the Johannesburg Stock Exchange (JSE)), which is comparable to that of most advanced economies (Balcilar et al. 2016, pp. 191–201; World Bank 2014). Poland was reclassified from an emerging market to a developed market status, effective as from 24 September, 2018 (Emerging Europe 2018). The Warsaw Stock Exchange (WSE) has a current market capitalisation of USD 223,17 billion compared to the JSE market capitalisation of USD 1,08 trillion (as at 25 August, 2022) (StockMarketClock 2022; Warsaw Stock Exchange 2022). Comparing the payout behaviour of Poland and South Africa will provide insights on the regulatory differences and the ef-fect therefore on payout – and whether these countries mirror the excessive payout behaviour observed in the US. This study covers the period from 2005 to 2015, including the pre- and post- 2008/2009 financial crisis. Context is therefore provided on payout behaviour in Poland and South Africa during the initial years since share repurchases were allowed, as well as on the effect of the 2008/2009 financial crisis on payout behaviour in these two coutries.
Therefore, the following research questions have been formulated:
RQ1: What are the regulatory differences on share repurchase behaviour in Poland and South Africa?
RQ2: What trends are noticed relating to dividend payments and share repurchase activity in Poland and South Africa – and did the 2008/2009 financial crisis affect the payout behaviour in these countries?
RQ3: Do examined countries mirror the excessive payout behaviour observed in the US?
The paper is organized as follows. Section 2 presents the literature review. The data and methodology are described in section 3, while section 4 presents the results of the study and the discussion. The last section presents conclusions and implications for further research.
Literature review
The issue of dividends, as historically a dominant form of cash transfer to shareholders, has been undertaken in research around the world for several decades (Lintner 1956, pp. 97–113; DeAngelo et al. 2006, pp. 227–254; Denis & Osobov 2008, pp. 62–82; Desai & Jin 2011, pp. 68–84; Hail et al. 2014, pp. 403–456; Booth & Zhou 2017, pp. 1–15). Share repurchases are still a relatively new legal solution, which in recent years has been the subject of many empirical studies (Dittmar 2000, pp. 331–355; Hribar et al. 2006, pp. 3–27; Peyer & Vermaelen 2009, pp. 1693–1745; Lee et al. 2010, pp. 114–125; Andriosopoulos & Hoque 2013, pp. 65–76; Andriosopoulos & Lasfer 2015, pp. 327–339; Almeida et al. 2016, pp. 168–185). Nevertheless, it is still an inadequately explored phenomenon.
Different motives support a decision to enter into share repurchases. The most frequently stated motivation is to signal to the market that the company’s shares are currently undervalued (the signalling theory). An increase in the share price subsequent to a share repurchase announcement (accompanied by the reduction in a number of shares in issue) benefits not only the remaining shareholders, but also executives whose remuneration is linked to the performance of the company’s share price and earnings per share (Kaźmierska-Jóźwiak 2019; Steenkamp 2020). Other motivations for share repurchases include dividend substitution (mainly based on the flexible nature of share repurchases); the free cash flow motive; change in capital structure; takeover defence; and, more recently, share option compensation (Kaźmierska-Jóźwiak 2019; Steenkamp 2020; Wesson et al. 2018).
Although there are regulatory differences between countries, certain concepts and practices relating to share repurchases apply in most of them. In general, there are three types of share repurchase methods, namely open market share repurchases, tender offers, and private offers. Open market share repurchases refer to shares acquired in the open market at the prevailing market price, while tender offers refer to offers made to existing shareholders to buy back their shares at a predetermined price, and private offers refer to privately negotiated repurchases from a specific group of shareholders (Wesson 2015). Open market share repurchases is the most popular share repurchase type globally – with 90% of US and European share repurchases executed via the open market (Banyi et al. 2008, pp. 460–474; Fairchild & Zhang 2005, pp. 2005–2021). Furthermore, tax treatment in most countries entails the application of capital gains tax (CGT) to share repurchases and a withholding tax on shareholders in respect of dividends – with CGT rates, in general, favouring share repurchases to dividends from a shareholder’s perspective (Wesson 2015).
There has been much attention throughout the literature paid to dividends and share repurchases separately, however, not many papers examine a corporate payout policy in a comprehensive way, taking into account both dividend payments and share repurchases. Country-specific regulatory environments may explain the difference in payout behaviour between countries. Most comparison studies on payout behaviour have been conducted in developed markets (Brav et al. 2005; Farre-Mensa et al. 2014; Farre-Mensa et al. 2021; Lee & Suh 2011; Von Eije & Megginson 2008), with limited evidence from developing coutries (Kowerski 2017; Sakinç 2017). This study aims to address this gap by studying two countries (Poland and South Africa) that both have sophisticated stock exchanges, but have traditionally been classified as developing coutries (albeit Poland’s reclassification as a developed country was subsequent to the analyzed period of this study).
Share repurchases in the Polish law
The Polish regulations maintain a general prohibition on the repurchasing shares (Article 362 § 1 of the Commercial Companies Code) with some exceptions, the list of which has been extended in relation to the previous legal act (e.g., share repurchase to prevent serious damage directly endangering the company; share repurchase to be offered for purchase to employees; share repurchase in other cases provided for in the Act). The share repurchases is only allowed if the repurchased shares have been fully covered; the total nominal value of the shares repurchased does not exceed 20% of the share capital, including the nominal value of the remaining shares which were sold by the company; the total repurchase price of shares, increased by the costs of their repurchase, is not higher than the reserve capital created for this purpose.
Despite the significant extension of the scope of cases allowing for the share repurchases, a categorical prohibition on their repurchases still applies in the Polish law. In the European Union (EU) countries, a different approach prevails – not by prohibition, but by defining the premises that must be met in order for the company to repurchase its own shares (Sakinç 2017, pp. 1–27). The company is obliged, regardless of the circumstances of share repurchase, to include information about the share repurchase program in the company’s statement of activities. The public information about share repurchases is disseminated through current and periodic reports. The company is required to indicate the legal basis and the purpose of share repurchase, the number of repurchasing shares with the average prices per share, face value of repurchased shares, their share in the capital and in the total number of votes (Kaźmierska-Jóźwiak 2019).
The limited number of free float shares is often a limitation for conducting an open market share repurchase program. Another disadvantage is usually a limited number of own shares, which may be included in the share repurchase program as a part of open market transaction. In the case of companies that have a strategic investor, this number usually does not exceed 5% of issued shares (Dąbrowski 2010, p. 130). It is also indicated that the repurchasing shares on the open market has a relatively low signalling value (Ikenberry et al. 1995; Sójka 2004, p. 75) in comparison with other methods of repurchasing shares. Research conducted on the American market shows that only a small part of the value announced in the buyback program is actually repurchased, and many companies announcing the program do not implement it at all (Jagannathan et al. 2000; Oded 2004). Bhattacharya and Jacobsen (2015, p. 726) indicate that 24% of all companies that announced the buyback program in the period 1985–2012 did not repurchase any shares from the market during the financial year in which the program was announced. The authors calculated that 13% of companies did not carry out the buy-back program within four consecutive financial years after the announcement of the buyback program.
The tax system in Poland (the classic system of double taxation of dividends) currently includes the same tax rate on dividend income as well as capital gains. However, for many years, capital income was not taxed in Poland at all, while 20% tax was paid on dividend income. In 2003, the dividend tax rate was reduced from 20% to 15%, at the same time with a still zero tax rate on capital gains. In 2004, a 19% capital income tax (Belka’s tax) was introduced, and at the same time the tax rate on dividends was raised to the 19% and corporate tax was reduced to 19% (from 27%) (Kaźmierska-Jóźwiak 2019, pp. 69–70).
Research on the Polish share repurchases is, similarly as in South Africa, meagre, mainly due to the lack of comprehensive share repurchase data. Earlier research focussed mostly on testing the signalling effect of share repurchases (i.a. Gurgul & Majdosz 2005, pp. 25–39; Słoński & Zawadzki 2012; Wrońska-Bukal-ska et al. 2017, pp. 245–257; Wrońska-Bukalska et al. 2018, pp. 245–257).
Share repurchases in South African law
Share repurchases were allowed in South Africa as from 1 July 1999, following the implementation of the Companies Amendment Act 37 of 1999 (Republic of South Africa 1999). Share repurchases are in general admissible in South Africa, provided that the solvency and liquidity requirements stipulated in Section 46 of the Companies Act (Republic of South Africa 2008) are met. The main differences between the South African regulatory environment pertaining to share repurchases and global practice relate to the announcement of share repurchases, the types of entities which may repurchase shares, the classification of treasury shares, and the tax treatment of share repurchases. Regarding the share repurchase types and authorisation of share repurchases, South Africa is comparable to practices followed in most countries (Wesson et al. 2015) – mainly with terminology differences applicable to share repurchase types (i.e. South African open market share repurchases are called general share repurchases, tender offers are called pro rata offers, and private offers are called other specific offers) while the authorisation required for all share repurchases (other than pro rata offers to non-related parties) by JSE-listed companies being shareholder approval (Wesson et al. 2015).
The announcement rules pertaining to share repurchases in South Africa affect the availability of share repurchase data in South Africa. Although specific share repurchases (or tender offers) need to be announced via the Security Exchange News Service (SENS) of the JSE once the terms of the repurchase have been agreed upon, general (or open market) share repurchases only need to be announced via SENS once the company has cumulatively acquired 3% of its initial number of issued shares (of that class, as at the date of the resolution) (Wesson et al. 2015).
The tax system in South Africa (also a classic system of double taxation of dividends comparable to the tax system in Poland) includes different tax rates on dividend income and capital gains. The current tax system in South Africa (a shareholder-level dividend tax) replaced the previous tax system (a company-level secondary tax on companies) on April 1, 2012 (Nel 2018). The change in the tax system during 2012 is argued as significant based on the effect on the after-tax values of distributions for shareholders as well as a different tax treatment of a general repurchase as opposed to a specific repurchase (Nel 2018). Taxes on dividends ranged from 12.5% to 10% for the period before April 1, 2012 and ranged from 15% to 20% for the period from April 1, 2012. The tax reform of consecutive increases in the CGT inclusion rate from March 1, 2012 resulted in companies being taxed at an effective CGT rate of 22.4% (as opposed to the initial 14% prior to March 1, 2012) and individuals being taxed at an effective CGT rate of between 7.2% and 18% (as opposed to the initial rates between 4.5% and 10% prior to March 1, 2012). The high volumes of South African share repurchases executed via subsidiaries prior to 2012 may have been attributed to the favourable tax treatment therefore (Wesson & Hamman 2012) before April 1, 2012, whilst the post-recession increase in dividends paid by JSE-listed companies may also be attributed to the positive impact of dividend distribution regulatory reform (Nyere & Wesson 2019).
Research on South African share repurchases is meagre, mainly due to the lack of comprehensive share repurchase data. Earlier research focussed on testing the information signalling effect of announced share repurchases (Bhana 2007; Daly 2002). The first comprehensive study on share repurchases by JSE-listed non-resource and non-financial companies, covering the period 1999–2009, reported that share repurchases had a slow start – mainly due to uncertainties related to the tax treatment thereof and inconsistencies between the Companies Act and stock exchange rules – but became a popular distribution method as from 2005 (Wesson 2015, pp. 180–196).
Research methods
The present study compares the share repurchases and dividends of non-financial and non- resource companies listed on the main board of the WSE (of Poland) and non-financial and non-resource companies listed on the JSE (of South Africa) for the period 2005–2015 (covering the pre- and post-crisis period). Delisted companies were excluded and companies with dual listing status where the main listing was not the Warsaw (in respect of Polish data) or JSE (in respect of South African data) were also excluded from the study population.
Share repurchase and dividend payout were expressed as payout composition ratios and payout to profit ratios, based on aggregate figures. Payout composition ratios comprised: the ratio of share repurchases to total payout, the ratio of dividends to total payout, the ratio of share repurchases to dividends. Payout to profit ratios comprised: the ratio of dividends to profit, the ratio of share repurchases to profit, the ratio of total payout to profit – with profit representing the profit after taxation figure as disclosed in companies’ annual reports.
Data for South African share repurchase and dividend ratios were collected from company annual reports and SENS announcements, by following the methodology of Wesson et al. (2015). Profit after tax was retrieved from the IRESS database. Data for Polish share repurchases entailed the capturing of share repurchases from Eikon Thomson Reuters database, company annual reports, Emis and Polish Press Agency announcements by following the methodology of Kaźmierska-Jóźwiak (2019). Data on dividends and profit were retrieved from the Thomson Reuters database.
Results and discussion
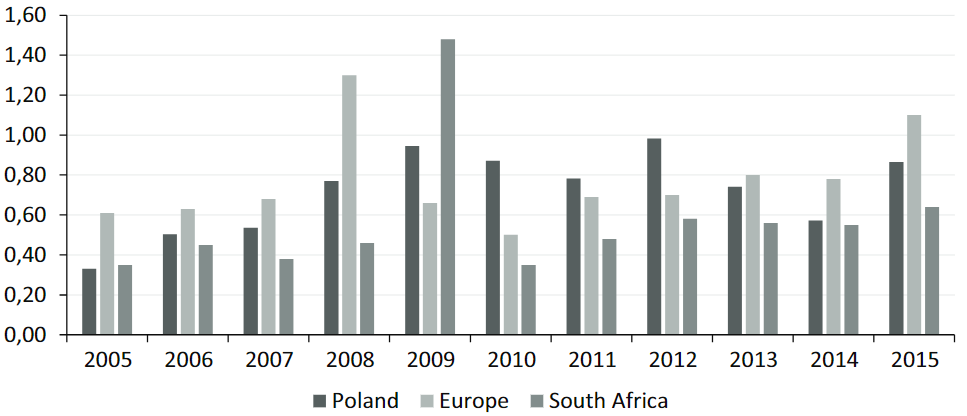
This part discusses the empirical data on share repurchases and dividends in Poland and South Africa, and where it is possible with some European and global data. Figure 1 presents relations between share repurchases and dividends. Data for Polish and South African companies is compared with data for European companies presented by Sakinç (2017, pp. 1–27), who analyzed 298 major companies from 16 countries (Austria, Belgium, Denmark, Finland, France, Spain, the Netherlands, Ireland, Luxembourg, Germany, Norway, Portugal, Sweden, Switzerland, United Kingdom, Italy), which were a part of the S&P Europe 350 index, which covers around 70% of the European market.
Figure 1. Share repurchases to dividends (Poland, South Africa, Europe)
Source: own elaboration based on Sakinç (2017), Kowerski (2017), Steenkamp (2020), Wesson (2015), Kaźmierska-Jóźwiak (2019)
Share repurchase activity of Poland, Europe and South Africa declined during the 2008/2009 recession period. Poland had the largest drop in share repurchases to dividends in 2009, followed by Europe – with South Africa showing the smallest decrease. The 2009 South African share repurchase value was, however, mainly attributable to a restructuring transaction by one company (MTN Limited) that attributed to 85% of the South African share repurchase value for 2009. Although the post-2010 trend in share repurchases to dividends is similar for Europe, Poland and South Africa, the Europen share repurchases to dividends ratio consistently outperforms the Polish and South African levels in the post-recession period.The highest ratio for Europe was recorded in 2007 (share repurchases constituted approximately 64% of dividends). In the case of Polish companies, the highest value of the ratio was observed in 2008, which is slightly later than on the European market. For South Africa, the highest level was recorded much earlier (in 2005), which supports earlier evidence on share repurchases becoming popular in South Africa post-2004 (Wesson 2015, pp. 180–196). Although Polish share repurchases were only taxed as from 2004, but at a similar rate as dividends, the flexibility of share repurchases is evident in the lower levels of share repurchases observed subsequently to the 2008/2009 financial crisis. On the other hand, South Africa’s difference in tax treatment of dividends and share repourchases seems to have affected the payout behaviour: as from 2012 (when the tax reform on dividends came into affect) share repurchases stabilised at lower levels than what was observed till 2009.
Figure 2. Share repurchases to total payouts (Poland, South Africa, Europe)
Source: as in Figure 1
Figure 2 presents share repurchases to total payouts for the same period (2005–2015). As we can observe, the trends are similar as for share repurchases to dividends. The European share repurchases to total payout ratio is the highest in most periods, with South Africa showing the highest share repurchase to total payout ratio in 2005, 2008 and 2009 and Poland showing its highest ratio in 2008. Share repurchases were not the preferred payout method in Europe, Poland or South Africa during the 2005 to 2015 period.
Referring to Table 1, it can be observed that share repurchases fluctuate more per annum as the dividend payouts, in line with the flexible nature of share repurchases. As from 2009, Polish companies pay out much larger proportions of their profits when compared to pre-2009, mainly attributable to increased dividend payouts. Companies in Poland have nearly doubled their payout to profit ratios when comparing pre-2010 and post-2010 payout behaviour. The extremely high payout to profit ratio (of 148%) in South Africa in 2009 is mainly attributable to low profits reported in 2009 and the outlier share repurchases reflecting one company’s (MTN Limited) restructuring transaction. Subsequent to 2011, South African share repurchases stabilised at lower levels than pre-2009, and dividends increased – which may be attributed to the favourable tax treatment of dividends as from April 1, 2012 (Steenkamp & Wesson 2020). South African companies, however, tend to spend a smaller percentage of their profits on payout than Polish companies.
Table 1. Payout to profit and payout composition – Poland vs South Africa
| Year |
Poland |
South Africa |
| Payout to profit (%) |
Payout composition (%) |
Payout to profit (%) |
Payout composition (%) |
| Div |
SR |
Total payout |
Div |
SR |
Div |
SR |
Total payout |
Div |
SR |
|
2005
|
27.02
|
6.05
|
33.07
|
81.7
|
18.3
|
21.85
|
13.10
|
34.95
|
62.52
|
37.48
|
|
2006
|
43.21
|
7.19
|
50.4
|
85.7
|
14.3
|
32.96
|
11.56
|
44.52
|
74.03
|
25.97
|
|
2007
|
38.97
|
14.66
|
53.63
|
72.7
|
27.3
|
30.12
|
7.53
|
37.65
|
80.00
|
20.00
|
|
2008
|
52.71
|
24.28
|
76.99
|
68.5
|
31.5
|
31.39
|
14.73
|
46.12
|
68.07
|
31.93
|
|
2009
|
91.52
|
2.96
|
94.48
|
96.9
|
3.1
|
113.57
|
34.26
|
147.84
|
76.82
|
23.18
|
|
2010
|
83.36
|
3.88
|
87.24
|
95.6
|
4.4
|
32.58
|
2.52
|
35.10
|
92.82
|
7.18
|
|
2011
|
70.58
|
7.58
|
78.16
|
90.3
|
9.7
|
40.30
|
8.09
|
48.38
|
83.29
|
16.71
|
|
2012
|
87.93
|
10.36
|
98.29
|
89.5
|
10.5
|
52.83
|
5.49
|
58.32
|
90.59
|
9.41
|
|
2013
|
67.79
|
6.41
|
74.2
|
91.4
|
8.6
|
53.22
|
2.89
|
56.10
|
94.85
|
5.15
|
|
2014
|
55.91
|
1.3
|
57.21
|
97.7
|
2.3
|
50.28
|
4.78
|
55.06
|
91.32
|
8.68
|
|
2015
|
81.55
|
4.9
|
86.45
|
94.3
|
5.7
|
57.08
|
7.31
|
64.39
|
88.65
|
11.35
|
|
Average
|
63.69
|
8.14
|
71.83
|
87.65
|
12.35
|
46.92
|
10.20
|
57.13
|
82.09
|
17.91
|
|
Median
|
67.79
|
6.41
|
76.99
|
90.30
|
9.70
|
40.30
|
7.53
|
48.38
|
83.29
|
16.71
|
Source: own elaboration
The payout to profit trends indicate that the financial crisis of 2008/2009 seemed to have affected Polish and South African companies differently. Polish companies have increased dividend payments while reducing share repurchases. In South Africa, it seems as if the change in the dividends tax regime (from a company-level to shareholder-level) – rather than the 2008/2009 financial crisis – affected payout behaviour. The South African payout to profit ratios show higher levels of payout only as from 2012 and support the expectation that a higher percentage of profits is paid out by companies to allow for equitable dividend receipts by shareholders subsequent to the dividend regulatory reform of 2012. The lower levels of share repurchases as from 2012 may also be attributed to the tax preference for dividends as from 2012.
Figure 3. Total payouts to net profit (Poland, South Africa, Europe)
Source: as in Figure 1
Looking at Figure 3, it can be observed that the total payout to profit in European countries was at its highest level in 2008. The ratio of the total payout to profit for Polish companies exceeded European ratio in 2009 to 2012. In 2013 the situation is reversing – the values of the ratio for Europe exceeded the value of the ratio for Polish companies. South Africa shows the lowest payout ratio in all periods, except in 2009, when compared to Europe and Poland. As from 2012, South African payout stabilised at higher levels than the pre-2009 levels.
Table 2 depicts the payout (dividends, share repurchases, dividends+share repurchases) to profit ratios of 16 European countries, Poland and South Africa. The European data represents the period from 2000 to 2015, while the Polish and South African data represents the period from 2005 to 2015. It is evident that share repurchases did not represent the favourite payout method (based on value) for any of these countries. Switzerland (at 31%) shows the highest share repurchases compared to dividends, whilst the lowest share repurchase activity is observed for Portugal (at 7%). Portugal, however, is the country that pays out the largest proportion of their profits (101%). Switzerland (62%) and Denmark (57%) represent the highest repurchase intensity (the relation between share repurchases and dividends), the lowest has been observed in Portugal (2%), Italy (8%), then, in Poland (13%). South Africa (21%) can also be regarded as paying relatively low levels of share repurchases – and is ranked similar to Belgium (21%) and slightly higher than Norway (20%).
When compared to the US practice, where 91% of profits were paid in dividends (37%) and share repurchases (54%) respectively in the period 2003–2013 (Lazonick 2014, pp. 46–55), it seems that only Portugal (101%), Great Britain (95%) and Finland (88%) show similar payout to profit ratios, but share repurchases were not the dominant method of distribution in any of these countries – as is the case in the US.
Table 2. Payout strategies in Poland, South Africa and European countries over the period 2005–2015 (%)
|
Dividend ratio
(DIV/NI) |
Share repurchase ratio
SR/NI |
Total payout ratio
(DIV+SR)/NI |
Repurchase intensity
SR/DIV |
| Switzerland |
50 |
31 |
81 |
62 |
|
Denmark
|
44
|
25
|
69
|
57
|
|
Luxembourg
|
50
|
25
|
76
|
50
|
|
Netherland
|
46
|
22
|
68
|
48
|
|
Finland
|
64
|
24
|
88
|
37
|
|
Great Britain
|
71
|
24
|
95
|
34
|
|
Ireland
|
58
|
29
|
77
|
32
|
|
France
|
36
|
12
|
48
|
30
|
|
Germany
|
61
|
18
|
79
|
26
|
|
Spain
|
46
|
12
|
58
|
25
|
|
Austria
|
50
|
13
|
63
|
23
|
|
South Africa
|
47
|
10
|
57
|
21
|
|
Belgium
|
42
|
10
|
52
|
21
|
|
Norway
|
58
|
12
|
70
|
20
|
|
Sweden
|
46
|
9
|
55
|
18
|
|
Poland
|
64
|
8
|
72
|
13
|
|
Italy
|
52
|
10
|
61
|
8
|
|
Portugal
|
94
|
7
|
101
|
2
|
Remark: the average for Europe – 2000–2015
DIV – dividend; SR – share repurchase; NI – net income
Source: as in Figure 1
Poland is one of the countries with the lowest repurchase intensity. However, based on the dividend to net income ratio, Poland (64%) – when compared to the 18 countries depicted in Figure 4 – ranks among the leading dividend paying countries. On the other hand, South Africa (47%) is among the lower dividend paying countries and ranked between Austria (50%) and the Netherlands (46%). This data indicates that share repurchases are not a popular payout policy instrument neither in Poland, nor in South Africa. In both countries dividends are preferred as a form of net income transfer to the shareholders.
Conclusions
Due to the area of our interest, we decided to compare some facts and figures regarding share repurchases versus dividends on two countries, which are located on two different continents: South Africa which is classified as a developing country, and Poland which was reclassified from an emerging market to a developed market status in September 2018 (Emerging Europe 2018).
Share repurchases are still a relatively new legal solution. In most of European countries, share repurchase was legal or easy to implement after regulatory changes between 1998 and 2000 (only in the UK share repurchases were allowed before 1990s). South Africa first allowed share repurchases as from 1 July 1999. Polish law maintains a general prohibition on the share repurchases with some exceptions – in 2000, the list of which has been extended in relation to the previous legal act. Both countries have sophisticated stock exchanges. In both countries research on payout policies of listed companies, mostly focuses on the dividend payouts. Firstly, because dividends are the dominant form of payouts to shareholders. Secondly, due to the lack of readily available share repurchase data. Dividends were the preferred payout method in South Africa, representing about 82% of payout value over the period 2005–2015. This phenomenon is even stronger in Poland, where dividends represent about 88% of payout value over the period 2005–2015. However, it is evident that share repurchases do not represent the favourite payout method (based on value) for any of European countries. When comparing the payout to profit over time, it is evident that share repurchases fluc-tuate more per annum as the dividend payouts. Nonetheless, what is evident is that as from 2010, Polish companies pay out much larger proportions of their profits when compared to pre-2010 payouts, mainly attributable to increased dividend payouts. South African payout, however, was the highest in 2009, with a steep drop in 2010 – mainly attributable to decreased share repurchases. South African total payout to profits in the period 2012–2015 are in general at slightly higher levels when compared with the pre-2009 values, attributable to increased dividends owing to the dividend regulatory reform effective as from April 2012.
The study examines the theoretical-legal and practical aspects of payout policy in Poland and South Africa over the period 2005–2015, covering the pre- and post- 2008/2009 financial crisis (RQ1 and RQ2). The comparative analysis of the legal aspects of the payout policy in Poland and South Africa provided insights on the regulatory differences. It should be noted that in the post-crisis period, dividend payout ratios increased significantly in both countries, while share repurchase ratios decreased. Changes in South African payout ratios were, however, mainly attributable to the change in the tax system in 2012. We have noticed that none of the examined countries mirrors the excessive payout behaviour observed in the US – neither in Poland, nor in SA did share repurchases surpass dividends (RQ 3).
The lack of availability of comprehensive share repurchase data both in Poland and South Africa, has affected the research period covered in this study. The authors are in the process of collecting data for subsequent years in order to conduct a comparative analysis of the payout policy behaviour of companies from Poland and South Africa during the COVID-19 pandemic crisis.
Bogna Kaźmierska-Jóźwiak, PhD, University of Lodz, Faculty of Management, Department of Corporate Finance Management, bogna.kazmierska@uni.lodz.pl
Nicolene Wesson, PhD, Stellenbosh University, Business School, nwesson@usb.ac.za
Gretha Steenkamp, PhD, Stellenbosch University, School of Accountancy, gvn@sun.ac.za
References
Almeida H., Fos V., Kronlund M. (2016), The real effects of share repurchases, “Journal of Financial Economics”, 119(1): 168–185. https://doi.org/10.1016/j.jfineco.2015.08.008
Andriosopoulos D., Hoque H. (2013), The determinants of share repurchases in Europe, “International Review of Financial Analysis”, 27: 65–76. https://doi.org/10.1016/j.irfa.2012.12.003
Andriosopoulos D., Lasfer M. (2015), The market valuation of share repurchases in Europe, “Journal of Banking & Finance”, 55: 327–339. https://doi.org/10.1016/j.jbankfin.2014.04.017
Balcilar M., Gupta R., Jooste C., Wohar M.E. (2016), Periodically collapsing bubbles in the South African stock market, “Research in International Business and Finance”, 38: 191–201. https://doi.org/10.1016/j.ribaf.2016.04.010
Banyi M.L., Dyl E.A., Kahle K.M. (2008), Errors in estimating share repurchases, “Journal of Corporate Finance”, 14(4): 460–474. https://doi.org/10.1016/j.jcorpfin.2008.06.004
Barnes M. (2015), Straight talk: Share buybacks defy all logic, http://www.bdlive.co.za/opinion/columnist/2015/05/04/straight-talk-share-buybacks-defy-all-logic (accessed: 10.06.2019).
Bhana N. (2007), The market reaction to open market share repurchases announcements: The South African experience, “Investment Analysts Journal”, 65: 25–36. https://doi.org/10.1080/10293523.2007.11082486
Bhattacharya U.E., Jacobsen S. (2016), The share repurchase announcement puzzle: Theory and evidence, “Review of Finance”, 20(2), 725–758. https://doi.org/10.1093/rof/rfv020
Booth L., Zhou J. (2017), Dividend policy: A selective review of results from around the world, “Global Finance Journal”, 34: 1–15. https://doi.org/10.1016/j.gfj.2017.07.002
Brav A., Graham J.R., Harvey C.R., Michaely R. (2005), Payout policy in the 21st century, “Journal of Financial Economics”, 77(3): 483–527. https://doi.org/10.1016/j.jfineco.2004.07.004
Daly K.J. (2002), Share returns of companies announcing share repurchases under a general authority, Unpublished research report. University of the Witwatersrand, Johannesburg.
Dąbrowski D. (2010), Nabywanie akcji własnych przez spółkę akcyjną, Wolters Kluwer Polska.
DeAngelo H., DeAngelo L., Stulz R.M. (2006), Dividend policy and the earned/contributed capital mix: a test of the life-cycle theory, “Journal of Financial Economics”, 81(2): 227–254. https://doi.org/10.1016/j.jfineco.2005.07.005
Denis D.J., Osobov I. (2008), Why do firms pay dividends? International evidence on the determinants of dividend policy, “Journal of Financial Economics”, 89(1): 62–82. https://doi.org/10.1016/j.jfineco.2007.06.006
Desai M.A., Jin L. (2011), Institutional tax clienteles and payout policy, “Journal of Financial Economics”, 100(1): 68–84. https://doi.org/10.1016/j.jfineco.2010.10.013
Dittmar A.K. (2000), Why do firms repurchase stock, “The Journal of Business”, 73(3): 331–355. https://doi.org/10.1086/209646
Emerging Europe (2018), Poland promoted to developed market status by FTSE Russell, https://emerging-europe.com/news/poland-promoted-to-developed-market-status-by-ftse-russell/ (accessed 10.06.2019).
Fairchild R., Zhang G. (2005), Repurchase and dividend catering, managing myopia, and long-run value destructions, Working Papaer Ser. 2005–21, University of Bath School of Management.
Farre-Mensa J., Michaely R., Schmalz M. (2014), Payout policy, „Annual Review of Financial Economics”, 6(1): 75–134. https://doi.org/10.1146/annurev-financial-110613-034259
Farre-Mensa J., Michaely R., Schmalz Martin C. (2021), Financing Payouts, “Ross School of Business” Paper No. 1263. https://ssrn.com/abstract=2535675 (accessed: 17.10.2022), https://doi.org/10.2139/ssrn.2535675
Gurgul H., Majdosz P. (2005), Effect of Dividend and Repurchase Announcements on the Polish Stock Market, “Badania Operacyjne i Decyzje”, 1: 25–39.
Hail L., Tahoun A., Wang C. (2014), Dividend payouts and information shocks, “Journal of Accounting Research”, 52(2): 403–456. https://doi.org/10.1111/1475-679X.12040
Hribar P., Jenkins N.T., Johnson W.B. (2006), Stock repurchases as an earnings management device, “Journal of Accounting and Economics”, 41(1–2): 3–27. https://doi.org/10.1016/j.jacceco.2005.10.002
Ikenberry D., Lakonishok J., Vermaelen T. (1995), Market underreaction to open market share repurchases, “Journal of Financial Economics”, 39(2–3): 181–208. https://doi.org/10.1016/0304-405X(95)00826-Z
Jagannathan M., Stephens C.P., Weisbach M.S. (2000), Financial flexibility and the choice between dividends and stock repurchases, “Journal of Financial Economics”, 57(3): 355–384. https://doi.org/10.1016/S0304-405X(00)00061-1
Kaźmierska-Jóźwiak B. (2019), Polityka wypłat na rzecz akcjonariuszy. Determinanty–reakcja rynku–ocena, Wydawnictwo Uniwersytetu Łódzkiego.
Kowerski M. (2017), Payout Policy of European Companies, “Barometr Regionalny. Analizy i Prognozy”, 15(3): 11–28. https://doi.org/10.56583/br.457
Lazonick W. (2014), Profits without prosperity, “Harvard Business Review”, 92(9): 46–55.
Lee B.S., Suh J. (2011), Cash holdings and share repurchases: International evidence, “Journal of Corporate Finance”, 17(5): 1306–1329. https://doi.org/10.1016/j.jcorpfin.2011.06.006
Lee C.I., Ejara D.D., Gleason K.C. (2010), An empirical analysis of European stock repurchases, “Journal of Multinational Financial Management”, 20(2–3): 114–125. https://doi.org/10.1016/j.mulfin.2010.07.002
Lintner J. (1956), Distribution of incomes of corporations among dividends, retained earnings, and taxes, “The American Economic Review”, 46(2): 97–113.
Nel R. (2018), Investor tax-driven preferences for dividends and share repurchases of listed companies, “South African Journal of Accounting Research”, 32(1): 71–87. https://doi.org/10.1080/10291954.2017.1414349
Nyere L., Wesson N. (2019), Factors influencing dividend payout decisions: Evidence from South Africa, “South African Journal of Business Management”, 50(1). https://doi.org/10.4102/sajbm.v50i1.1302
Oded J. (2011), Stock repurchases: How firms choose between a self-tender offer and an open-market program, “Journal of Banking & Finance”, 34(12): 3174–3187. https://doi.org/10.1016/j.jbankfin.2011.05.006
Peyer U., Vermaelen T. (2009), The nature and persistence of buyback anomalies, “The Review of Financial Studies”, 22(4): 1693–1745. https://doi.org/10.1093/rfs/hhn024
Republic of South Africa (RSA). (1999), Companies Amendment Act, No. 37 of 1999, Pretoria.
Republic of South Africa (RSA). (2008), Companies Amendment Act, No. 71 of 2008, Pretoria.
Sakinç M.E. (2017), Share Repurchases in Europe. A Value Extraction Analysis, (pp. 1–27). The Academic-Industry Research Network Working Paper (16/2017 May).
Słoński T., Zawadzki B. (2012), The Signaling Effect and Abnormal Returns of Open Market Share Repurchases in Poland. https://ssrn.com/abstract=2081991 (accessed: 28.10.2020), https://doi.org/10.2139/ssrn.2081991
Sójka T. (2004), Umorzenie akcji. Kantor Wydawniczy Zakamycze, Kraków.
Steenkamp G. (2020). The relationship between share repurchases and share-based remuneration of executive directors of South African listed companies, Unpublished PhD thesis. University of Stellenbosch Business School, Cape Town.
Steenkamp G., Wesson N. (2020), Post-recession share repurchase behaviour by JSE-listed companies: transparent or not?, “Journal of Accounting in Emerging Economies”, 10(3); 465–486. https://doi.org/10.1108/JAEE-02-2020-0040
StockMarketClock. (2022), List of stock exchanges, https://www.stockmarketclock.com/exchanges (accessed: 25.09.2022).
Stonham P. (2002), A game plan for share repurchases, “European Management Journal”, 20(1): 37–44. https://doi.org/10.1016/S0263-2373(01)00112-8
Von Eije H., Megginson W.L. (2008), Dividends and share repurchases in the European Union, “Journal of Financial Economics”, 89(2): 347–374.
Warsaw Stock Exchange. (2022), https://www.gpw.pl/gpw-statistics (accessed: 25.09.2022), https://doi.org/10.1016/j.jfineco.2007.11.002
Wesson N. (2015), An empirical model of choice between share repurchases and dividends for companies in selected JSE-listed sectors, Unpublished PhD thesis. University of Stellenbosch Business School, Cape Town.
Wesson N., Bruwer B.W., Hamman W.D. (2015), Share repurchase and dividend payout behaviour: The South African experience, “South African Journal of Business Management”, 46(3): 43–54. https://doi.org/10.4102/sajbm.v46i3.100
Wesson N., Hamman W.D. (2012), The repurchase by a holding company of treasury shares held by subsidiaries: A South African perspective, “South African Journal of Business Management”, 42(4): 33–44. https://doi.org/10.4102/sajbm.v43i4.480
World Bank. (2014), World development indicators 2014 (accessed: 10.06.2019).
Wrońska-Bukalska E., Kaźmierska-Jóźwiak B. (2017), Signaling hypotheses of share repurchase – life cycle approach. The case of Polish listed companies, “Equilibrium. Quarterly Journal of Economics and Economic Policy”, 12(2): 245–257. https://doi.org/10.24136/eq.v12i2.13
Wrońska-Bukalska E., Kaźmierska-Jóźwiak B., Rozkovec J. (2018), The information content of share repurchase – evidence from Poland, “Ekonomie a Management”, 21(2): 172–185. https://doi.org/10.15240/tul/001/2018-2-012
Streszczenie
Polityka w zakresie nabywania akcji własnych a polityka dywidend – analiza porównawcza Polski i RPA
Głównym celem opracowania jest porównanie trendów w obszarze nabywania akcji własnych i wypłaty dywidendy przez spółki niefinansowe i niezasobowe notowane na giełdach w Polsce i RPA w latach 2005–2015. Chociaż RPA jest krajem rozwijającym się o dualistycznej gospodarce, kraj ten charakteryzuje się zaawansowaną giełdą papierów wartościowych, która jest porównywalna do większości zaawansowanych gospodarek. Natomiast Polska została przeklasyfikowana z rynku wschodzącego na status rynku rozwiniętego dnia 24 września 2018 r. Analiza porównawcza dostarcza wglądu w różnice regulacyjne i ich wpływ na zachowania spółek w obszarze polityki wypłat na rzecz akcjonariuszy (nabywanie akcji własnych i wypłaty dywidend) oraz pozwala określić, czy kraje te odzwierciedlają zachowania związane z payout policy obserwowane w Stanach Zjednoczonych. Wyniki badania pokazują, że w obu krajach dywidendy są dominującą formą wypłat dla akcjonariuszy. Ponadto w żadnym z badanych krajów nie zaobserwowano zachowań w zakresie wypłat na rzecz akcjonariuszy występujących w USA – ani w Polsce, ani w RPA środki wydane na nabycia akcji własnych nie przewyższały wartości wypłaconych dywidend. Różnice regulacyjne pomiędzy Polską a RPA wpłynęły jednak na obserwowane trendy w zachowaniach wypłat pomiędzy tymi dwoma krajami.
Słowa kluczowe: dywidenda, nabywanie akcji własnych, polityka wypłat, Polska, RPA
© by the author, licensee University of Lodz – Lodz University Press, Lodz, Poland. This article is an open access article distributed under the terms and conditions of the Creative Commons Attribution license CC-BY-NC-ND 4.0 (
https://creativecommons.org/licenses/by-nc-nd/4.0/)