Sexual Dimorphism at Different Stages of Ontogenesis Based on the Kraków – Longitudinal Growth Study, Poland
 https://orcid.org/0000-0001-5006-0798
Department of Anthropology, Institute of Biomedical Sciences, Faculty of Physical Education and Sport, University of Physical Culture, Kraków, Poland
Department of Physical Education, Faculty of Medicine and Health Sciences, University of Applied Sciences in Tarnów, Poland
https://orcid.org/0000-0003-1548-6536
Department of Anthropology, Institute of Biomedical Sciences, Faculty of Physical Education and Sport, University of Physical Culture, Kraków, Poland
https://orcid.org/0000-0001-7830-5726
Department of Anthropology, Institute of Biomedical Sciences, Faculty of Physical Education and Sport, University of Physical Culture, Kraków, Poland
https://orcid.org/0000-0002-3375-7814
Department of Anthropology, Institute of Biomedical Sciences, Faculty of Physical Education and Sport, University of Physical Culture, Kraków, Poland
Abstract
Introduction and Study Aim
The aim of the study is to assess the magnitude of changes in sexual dimorphism with respect to selected morphological traits and the results of physical fitness tests between the ages of 8 and 50.
Material and Methods
The data come from the Kraków Longitudinal Growth Study and pertain to the somatic development and physical fitness of individuals born in 1970 and 1972, conducted in Kraków from 1976 and 1980 up to 2022. The Mollison Index was used to calculate sexual dimorphism.
Results
The females were shorter, lighter and thinner than the males in all analysed age groups, and differed only with regard to body height in the 13-year-olds. They were characterised by lower stronger hand strength and lower limb explosiveness throughout the analysed period. With the exception of 8-year-olds, the females had smaller arm circumference, shoulder width and thigh circumference than the males at ages 32 and 50, and at age 17, the girls demonstrated larger thigh circumference. Up until adolescence, the girls had greater body fat under the scapula, on the triceps and in the abdomen compared to the boys. However, in both 32–34- and 50-year-olds, the men exhibited greater body fat under the scapula and in the abdomen.
Conclusions
A high degree of sexual dimorphism occurs during developmental age – at the end of the adolescence period, especially for fat folds on the triceps and abdomen. Greater dimorphism is observed later, in early adulthood, i.e., at the age of 32–34 years, in terms of height and body weight, as well as body mass index, circumferences – of the arm and thigh, shoulder width, and performance test results. In adulthood (around the age of 50), a noticeable decrease in the degree of sexual dimorphism is observed, which results from the nature of involutional changes.
Keywords: morphological characteristics, physical fitness tests results, longitudinal study, childhood, adolescence, adulthood
Introduction
Dimorphism in humans, as established in the 1950s, is based on genetic determinism of development. Biologically, an individual’s masculinity or femininity is established on the basis of XX chromosomes in females and XY chromosomes in males. The resulting different ratios between androgens and oestrogens secreted by both sexes determine the course of prenatal and postnatal development, leading to biological male and female development. It is worth noting that humans, compared to the majority of primates, exhibit slight dimorphism, but it is nevertheless visible from birth (Greil, 2006). Human sexual dimorphism relates to body structure, biochemical and physiological properties, neurohormonal activity, as well as behavior patterns and lifestyle.
During prenatal life and early childhood, body composition variation is small. Immediately after birth, morphological dimorphism is primarily expressed by shorter length and birth weight, and greater body fat in girls than in boys (Greil, 2006). Developmental differences related to sex during this period are estimated to be only 2–3% (Perenc & Radochońska, 2012). During childhood, on average up to 6 years of age, sexual dimorphism remains slight, and its intensity is observed at the onset of puberty (Wells, 2007). The sexual dimorphism that intensifies during puberty is mainly the result of different developmental rates (growth and maturation) in both sexes. On average, girls develop earlier than boys, therefore, between the ages of 9 and 14, they become significantly taller and heavier. After the pubertal growth spurt (at approximately age 14), girls’ development slows down, while remaining rapid for their peers. This is due to the fact that the pubertal growth spurt begins later and lasts longer in boys than in girls. This different pace of development leads to the typical morphological differences between adults of the opposite sexes developing during this period – males become taller and heavier than females (Greil, 2006). Differences in body proportions also develop during this period – girls are taller than boys and begin to have a relatively wider pelvis. Boys, on the other hand, begin to have relatively longer lower limbs and comparatively wider shoulders than their peers. Differences in body composition also emerge during this period. Girls experience an increase body fat, while boys demonstrate an increase in lean body mass – particularly muscle and bone mass (Wells 2007; Sterkowicz & Żak, 2010). A consequence of these morphological variances are sex differences related to the physiology of movement. Females have a higher heart rate, lower stroke volume, cardiac output, haemoglobin, red blood cell counts, maximal oxygen uptake and vital lung capacity (Sterkowicz & Żak, 2010). At the end of puberty and the onset of young adulthood, dimorphism becomes most apparent and is estimated at approximately 8% (Greil, 2006; Perenc & Radochońska, 2012). After late adulthood, women experience apparent biological masculinisation and oestrogen dominance appears in men (Wolański, 2006). However, this does not eliminate dimorphism, but rather changes it. According to some researchers, dimorphism decreases in old age (Wells, 2007), while others believe it increases (Wolański, 2006). The ambiguous results of research on changes in body dimorphism with age may be related to the fact that they were obtained based on cross-sectional studies (Hägg & Jylhäva, 2021; Xiao et al., 2020). However, little is known about changes in dimorphism within populations throughout their lifetime.
The population of Kraków undergoes regular monitoring of parameters related to body size, proportions, and physical fitness (Chrzanowska et al., 1988; 2002; Gołąb et al., 2003; Jasicki, 1938; 1948; Kowal et al., 2011; 2013; Kryst et al., 2023; Woronkowicz et al., 2012; Żegleń et al., 2020 and others). These were mostly cross-sectional studies.
Conducted since the 1976s and 1980s by the Department of Anthropology at the Institute of Biomedical Sciences of the University School of Physical Education, two series of continuous studies, which were merged in 2004 as the Kraków Longitudinal Growth Study (KLGS), have enabled the analysis of numerous issues, including ontogenetic changes and sexual dimorphism in the distribution of subcutaneous fat a 12-year longitudinal study of children and adolescents from Kraków (Chrzanowska & Suder, 2008); predicting the timing of reaching maturity and peak height velocity (Malina et al., 2021); age at pubarche and the risk of developing cardiometabolic complications among men aged 50–52 from KLGS (Spring et al., 2024); predicting adult height in boys: the Zarow method and a comparative analysis of different methods (Żarów, 2001); body build and physical activity in adults and it’s biological development in childhood youthfulness (Żarów et al., 2006) childhood and adolescence changes in physical fitness and body composition of women and men examined in 2004 and 2022 – a longitudinal study (Żarów et al., 2024) and many other research problems.
The aim of this article is to assess the magnitude of changes in sexual dimorphism in certain morphological traits and physical fitness test results from ages 8 to 50, using the example of the KLGS. The following research question was formulated: How does the course and magnitude of changes in sexual dimorphism in ontogeny (at ages 8–50) in terms of selected morphological traits and tests of static and explosive strength of the upper and lower limbs, considered indicators of human health condition? The presented analysis of the results is primarily descriptive and partially explanatory.
Material and methods
Approval was for this research was obtained from the Bioethics Committee at the District Medical Chamber in Kraków for the study in 2022 (Consent No. 65/KBL/OIL dated April 11, 2022). The research material consists of data from KLGS on the somatic development and physical fitness of people born in 1970 and 1972, conducted in Kraków in the years 1976–2022 (KLGS 1976–2022) by research teams of the Department of Anthropology, Institute of Biomedical Sciences at the University School of Physical Education in Kraków (currently the University of Physical Culture):
- 1st series of annual examinations in the years 1976–1988 (age 6–18);
- 2nd series of annual examinations in 1980–1990 (age 8–18);
The first series of studies concerned people born in 1970; at the age of 6 there were 485 boys and 455 girls, and by the age of 18, 180 boys and 145 girls remained. The second series of studies involved people born in 1972, and at the age of 8 there were 460 boys and 360 girls, and by the age of 18, 178 boys and 108 girls remained. The decrease in the number of participants in subsequent years is a natural consequence of longitudinal studies:
- two combined series of women and men examined in 2004 (age 32–34);
- re-examination, after 18 years, of the same women and men in 2022 (age 50–52).
In total, 103 females and 122 males participated in the study in 2004, and in 2022, 47 and 67, respectively. Of these participants, 35 females and 47 males were present for both measurements in 2004 and 2022. No morphological selection of the women or men who participated in the 2022 study was observed in comparison to the 2004 trial, as the height of 103 females examined in 2004 was 165.2 cm, and 37 examinees were 164.4 cm tall; and, respectively, 178.1 cm for 122 males and 178.3 cm for 53. In terms of body mass, the values were 59.8 kg and 58.5 kg for the females, and 80.7 kg and 79.6 kg for the males.
The study included data (Table 1) on the morphological characteristics of 83 females and 92 males aged 8 to 17 and 67 and 70 for physical fitness tests. Fewer boys and girls participated in the physical fitness tests due to the inability to perform a given test on the day of the examination for various reasons (e.g., temporary injury). And in the studies conducted in 2004 and 2022, 35 females and 49 males participated. No exclusion criteria were applied in subsequent years of the study. Spontaneous selection occurred – e.g., absence on the day of the study for various reasons, change of residence, not accepting the invitation to participate in the study despite multiple email, phone, and mail invitations, deaths, etc. All participants were residents of the city of Kraków. The studied sample represented the average population of the city of Kraków.
| Age (in years) | Morphological characteristics | Physical fitness tests results | ||
|---|---|---|---|---|
| Females | Males | Females | Males | |
| 8* | 83 | 92 | 67 | 70 |
| 13* | 83 | 92 | 67 | 70 |
| 17* | 83 | 92 | 67 | 70 |
| 32–34 | 35 | 47 | 35 | 47 |
| 50–52 | 35 | 47 | 35 | 47 |
*Age was calculated according to the following rule: for example, eight-year-olds were considered to be people aged from 7.50 to 8.49 years, and similarly for the categories of 13- and 17-year-olds.
The following measurements were performed. Physical fitness tests included handgrip strength of stronger hand in both the right and left hand, and standing broad jump. Physical fitness tests were conducted according to the instructions of the ICSPFT test (Larson, 1974). Anthropometric measurements included:
- body height – measured according to Martin’s technique using an anthropometer (GPM, Switzerland, to the nearest 1 mm);
- body mass – using an electronic scale, and since 1994 using a body composition analyser, Tanita TBF-300 (Japan), to the nearest 0.01 kg;
- thigh and mid-upper-arm (MUAC, in relaxation) circumferences measured with a non-stretchable anthropometric tape;
- of triceps, subscapular and abdominal skinfold thickness – measured with a skinfold caliper (Harpenden type with constant pressure of 10g/mm2, to the nearest 1 mm)
- shoulder width – measured with a large spreading calliper (GPM, Switzerland, to the nearest 1 mm).
Body mass index (BMI) was calculated as the proportion of body mass in kilogrammes to body height expressed in metres squared. The level of sexual dimorphism was calculated via Mollison’s Index (MI): MI = (Xf-Xm)/SDm (Drozdowski, 1998), where: Xf mean value of the parameter for females, Xm mean value of the parameter for males, SDm standard deviation of the parameter for males. Negative values of the index indicate a lower level of development of a given trait in women.
Basic descriptive statistics (means and measures of variability) were calculated. The statistical significance of the differences between the analysed sexes was estimated using the Student’s t-test for independent samples. For variables where the assumption of homogeneity of variances was found to be violated – as verified using Levene’s test – the Welch-corrected Student’s t-test was used, which accounts for unequal variances. The calculations were performed using the Statistica 13.0 package.
Results
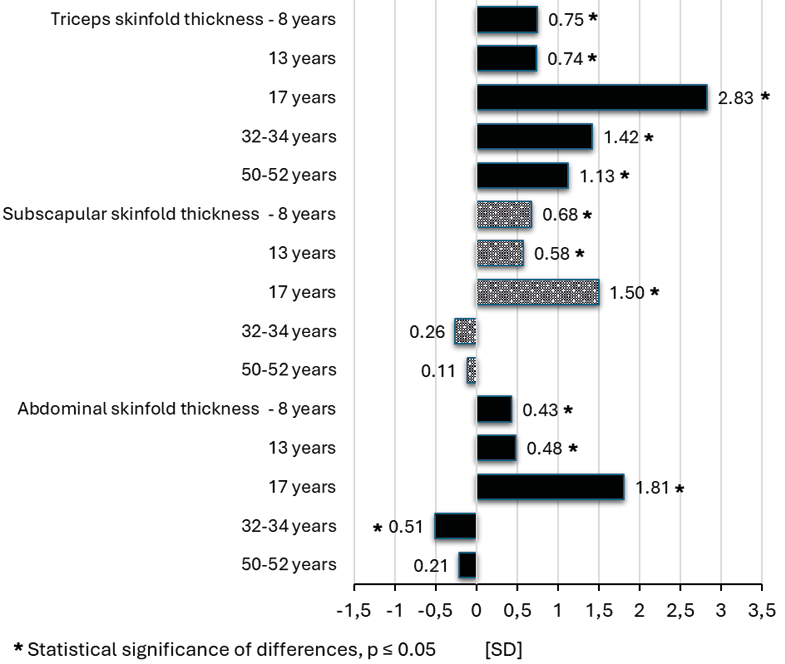
Table 2 shows the arithmetic means and standard deviations, which were the basis for calculating MI. The degree of sexual dimorphism according to MI of selected somatic features and physical fitness tests is presented in Figures 1–3.
| Girls N = 83; Boys N = 92 | Women N = 35; Men N = 47 | ||||
|---|---|---|---|---|---|
| 8 yrs. | 13 yrs. | 17 yrs. | 32–34 yrs. | 50–52 yrs. | |
| Mean; SD | Mean; SD | Mean; SD | Mean; SD | Mean; SD | |
| Body height [cm] | |||||
| Women | 127.0; 5.6 | 156.0; 7.2 | 163.7; 6.0 | 164.4; 5.9 | 164.2; 5.9 |
| Men | 127.4; 5.3 | 155.8; 8.4 | 175.0; 6.5* | 178.3; 5.8* | 178.0; 5.9* |
| Body mass [kg] | |||||
| Women | 25.3; 4.3 | 44.2; 7.7 | 55.1; 6.4 | 58.5; 7.2 | 66.4; 10.9 |
| Men | 26.1; 3.8 | 44.7; 8.7 | 64.7; 7.8* | 79.6; 10.7* | 88.1; 16.0* |
| Body Mass Index [kg/m2] | |||||
| Women | 15.6; 1.9 | 18.1; 2.2 | 20.6; 2.0 | 21.6; 2.5 | 24.6; 3.9 |
| Men | 15.9; 1.7 | 18.3; 2.3 | 21.1; 2.0 | 25.0; 2.9* | 27.8; 4.6* |
| Stronger hand grip strength [kG] | |||||
| Women | 10.9; 3.0 | 23.3; 4.5 | 30.9; 6.0 | 37.4; 3.9 | 34.4; 4.5 |
| Men | 13.1; 4.0* | 28.2; 6.7* | 50.1; 9.0* | 60.2; 6.9* | 55.9; 7.4* |
| Standing broad jump [cm] | |||||
| Women | 121.3; 17.4 | 161.8; 17.1 | 173.3; 17.3 | 163.9; 19.3 | 140.8; 19.8 |
| Men | 125.9; 17.3 | 177.5; 20.9* | 218.4; 20.9* | 212.2; 24.4* | 182.1; 19.5* |
| Arm circumference [cm] | |||||
| Women | 18.5; 1.7 | 22.1; 2.3 | 25.2; 1.8 | 26.3; 2.3 | 28.5; 3.1 |
| Men | 18.4; 1.7 | 22.4; 2.4 | 27.4; 2.2* | 31.0; 2.5* | 32.4; 3.7* |
| Thigh circumference [cm] | |||||
| Women | 38.4; 3.8 | 48.1; 4.5 | 54.0; 3.6 | 53.0; 3.7 | 55.8; 5.1 |
| Men | 37.6; 3.7 | 46.2; 4.6* | 53.2; 3.8 | 56.9; 4.2* | 57.0; 5.3 |
| Biacromial diameter [cm] | |||||
| Women | 27.4; 1.4 | 32.8; 1.7 | 35.3; 1.4 | 35.8; 1.3 | 36.3; 1.8 |
| Men | 27.9; 1.3* | 33.2; 2.2 | 39.3; 2.1* | 40.9; 1.6* | 41.5; 1.7* |
| Triceps skinfold [mm] | |||||
| Women | 10.1; 3.5 | 11.5; 3.9 | 14.0; 4.1 | 13.7; 5.0 | 18.3; 5.4 |
| Men | 8.3; 2.4* | 9.2; 3.1* | 7.5; 2.3* | 9.0; 3.3* | 12.2; 5.4* |
| Subscapular skinfold [mm] | |||||
| Women | 7.4; 3.8 | 9.1; 3.7 | 12.1; 4.5 | 13.7; 6.2 | 19.8; 7.1 |
| Men | 5.9; 2.2* | 7.3; 3.1* | 8.5; 2.4* | 15.3; 6.2 | 20.6; 7.0 |
| Abdominal skinfold [mm] | |||||
| Women | 8.5; 5.4 | 10.3; 5.5 | 15.1; 5.5 | 13.2; 6.6 | 20.1; 6.5 |
| Men | 6.9; 3.7* | 8.0; 4.8* | 8.6; 3.6* | 17.0; 7.5* | 21.7 7.8 |
* statistically significant differences (p<0.05) between 8, 13 and 17-year-old boys and girl
Sexual dimorphism in body height, mass and BMI, as well as two physical fitness tests results, for individuals aged 8, 13, 17, 32–34 (2004 series) and 50–52 (2022 series) are presented in Figure 1. We considered that the age of 8 years is a good moment to indicate the prepubertal period for both boys and girls, 13 years old is the period of adolescence, and 17 years old is practically the end of the pubertal period. The developmental status of children aged 6 and 7 was not included in this study (Gołąb et al., 1993).
The results obtained for the females were normalised to the arithmetic mean and standard deviation of the males. Data analysis revealed that the females were shorter, lighter and slimmer compared to the males in all of the analysed age groups. The exception was height among the 13-year-olds, when girls were slightly taller than boys. The smallest differences between the sexes for all analysed traits were found at age 13, at 0.02, 0.05 and 0.07 standard deviations, respectively. In subsequent years, the level of sexual dimorphism increased until age 32–34, while at age 50–52, it decreased for all the traits under analysis.
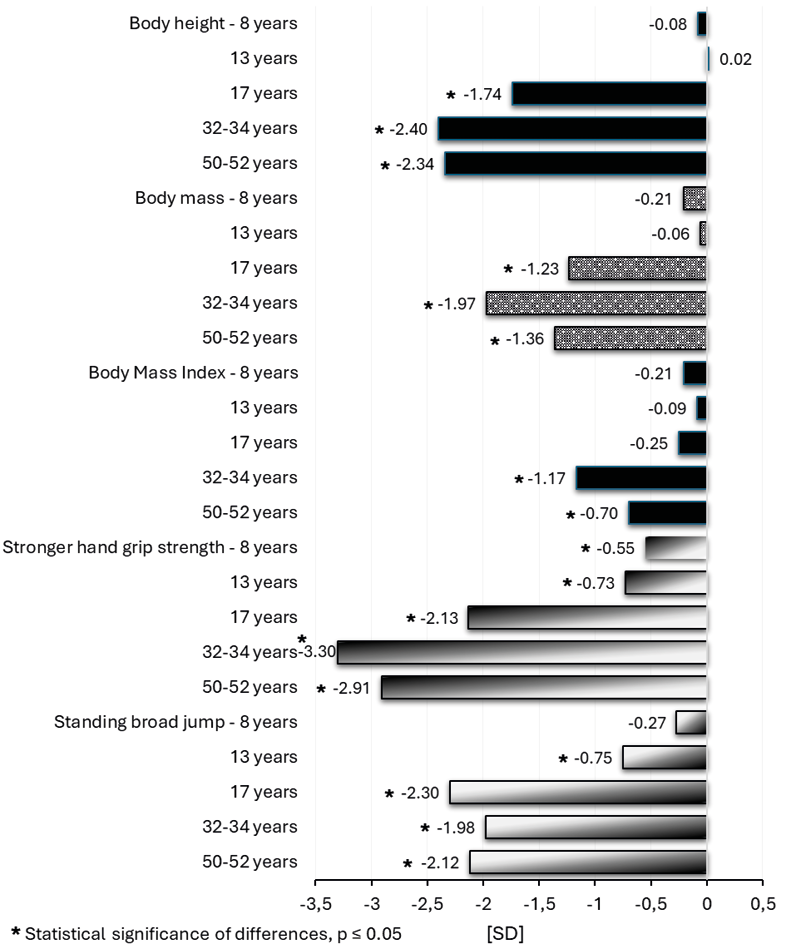
Statistically significant differences between the sexes were found for body mass and height in the 17-year-old groups and for all analysed characteristics in the 32–34- and 50–52-year-old groups (p<0.001). Based on the results of physical fitness tests, it was found that throughout the analysed period, the females were characterised by lower strength in the stronger arm and lower explosive strength in the lower limbs. The level of dimorphism in explosive strength of the lower limbs increased throughout the analysed period, reaching its highest value in the 50-year-old group (2.67 standard deviations). However, the level of dimorphism in arm strength increased until the age of 32–34 and then began to decline. Statistically significant differences between the sexes were found for both characteristics in all age groups (p<0.001). The exception was explosive strength of the lower limbs in the 8-year-old group.
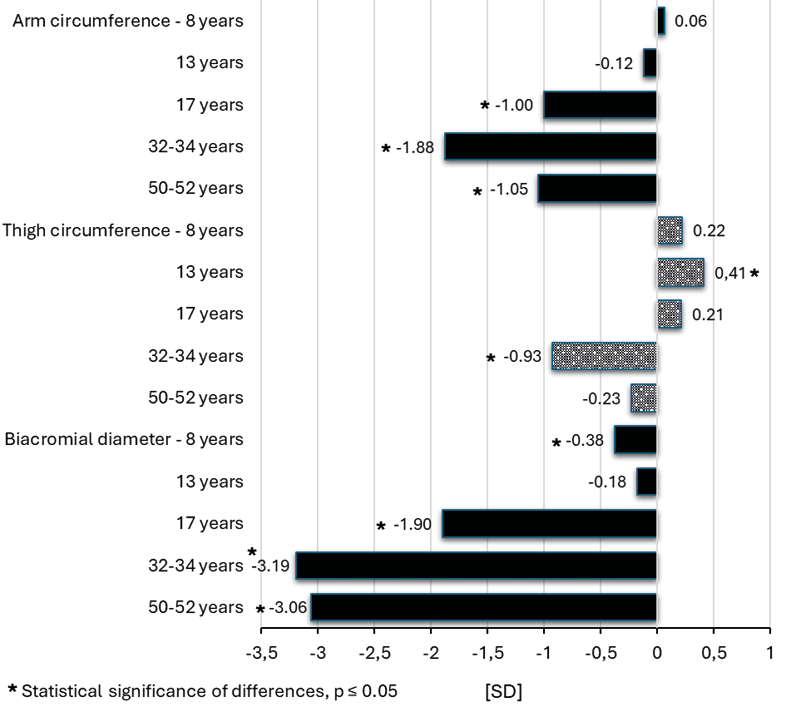
It was found that throughout the analysed period, with the exception of 8-year-olds, the females had smaller upper arm circumferences than the males (Fig. 2). The level of dimorphism was lowest in the youngest age group, reaching 0.06 standard deviations. In subsequent years, the level of dimorphism increased, reaching a maximum value of 1.88 standard deviations in 32- to 34-year-olds, after which it decreased to 1.03 standard deviations. Differences between the sexes were statistically significant (p<0.001), except for the 8- and 13-year-olds. Based on the results, it was found that until the age of 17, the girls had larger thigh circumferences. The level of dimorphism in this trait was small, with statistically significant differences found only in the 13-year-olds (p<0.01). With age, the males began to dominate in this trait and the level of dimorphism increased statistically significantly among 32–34-year-olds (p<0.001), and then slightly decreased.
It was demonstrated that throughout the analysed period, the females had smaller shoulder widths than the males. The level of dimorphism in this trait during childhood was low, reaching its lowest value in the 8-year-olds. In subsequent years, the level of dimorphism in this trait increased, reaching its highest values at ages 32–34, before decreasing slightly. Statistically significant differences were found in all age groups except for the 13-year-olds.
Analysing differences in body fat levels and fat distribution (Fig. 3) revealed that until adolescence, the girls demonstrated greater body fat than the boys in the subscapular, triceps and abdominal regions. In 8-year-olds, the level of dimorphism was 0.68, 0.74 and 0.43 for standard deviations, respectively, and the differences between the sexes were statistically significant (p<0.05). In 13-year-olds, the level of dimorphism remained similar, but in adolescence, it reached the highest values of 0.9, 2.82 and 1.82 for standard deviations, respectively. The differences were statistically significant (p<0.001). In adults, the level of dimorphism decreased, reaching the lowest values in the latter age group. Importantly, both in the 32–34- and 50-year-olds, the men had higher levels of subscapular and abdominal fat. Statistically significant differences were found in triceps (p<0.001) and abdominal skinfold thicknesses (p<0.05) in the age range of 32–34, whereas in 50-year-olds, these variations were only noted in triceps skinfold thickness (p<0.001).
Discussion
Analysis of the results from our longitudinal research on body height and mass revealed that the females were, on average, lighter, shorter (with the exception of the average height of girls at age 13) and slimmer than the males throughout almost the entire ontogenetic period under review. However, the level of dimorphism in these traits during childhood and the onset of puberty was not statistically significant. Among 17-year-olds (the stage of puberty completion), sex differences in body mass, height and BMI became statistically significant and increased up until the age of 32–34, when they were most pronounced. They then decreased slightly after the next two decades, at the age of 52.
It is well known that at birth, boys are approximately 1 cm (approx. 1–2%) longer and slightly heavier than girls (Wells, 2007). During childhood, dimorphism of body height and mass remain slight until the onset of puberty. Therefore, girls are shorter than boys until about 9 years of age, and then, during the pubertal period—between 9 and 12 years of age—they begin to exceed their peers by approximately 0.1%–0.6%. This is due to the earlier onset of the pubertal growth spurt in boys. The height advantage in boys, leading to a more pronounced lead in this trait in adulthood, begins at 0.4% after age 13 and becomes more marked with each subsequent year. It is most noticeable in early adulthood (19–30 years), when women are 7.4%–7.6% shorter than men of the same chronological age. This height difference decreases once more in later adulthood. By age 60, women are only 6.0% shorter than men (Greil & Lange, 2007). Our results are therefore consistent with other data. Similar results were obtained in Germany, where in cross-sectional research conducted among children and adults from birth to age 60, it was shown that the level of height dimorphism increased until age 30, after which it began to decrease (Greil & Lange, 2007). Similarly, in Austrian research conducted among individuals between 20 and 85 years, it was demonstrated that the level of height dimorphism was the highest in the youngest age group, and began to decrease starting approximately age 30. Interestingly, in these studies, it has been demonstrated that the level of body mass dimorphism increases with age, but the rate of change in body mass and height results in a decrease in BMI dimorphism (Peter et al., 2014).
A slightly varying result was achieved in a Norwegian cross-sectional study, conducted among 20–80-year-olds. These researchers showed that the level of height dimorphism increased throughout the analysed period, while the level of body mass dimorphism decreased from around the age of 30 (Drøyvold et al., 2006). Contrastingly, in longitudinal research conducted in the USA, it was noted that the level of height dimorphism among individuals above the age of 50 increased with age (Gallowye et al., 1990), while in research performed in the Netherlands, the opposite phenomenon was exhibited. It was shown that the level of height dimorphism increased until approximately the age of 30, and then began to slightly decrease (Nooyens et al., 2008). In a longitudinal study conducted in Sweden, It has been shown that the level of body dimorphism in terms of body massiveness (assessed using BMI) initially increased until around the age of 30 and then began to decrease (Caman et al., 2013). Similar results were obtained in a Norwegian study, which found that body mass dimorphism in individuals aged 20–35 did not change, but began to increase around the age of 35, whereas the level of body massiveness dimorphism slightly decreased (Nooyens et al., 2008).
Analysing differences in body fat levels and its distribution, we noted that up until adolescence, the examined girls had greater body fat under the scapula, on the triceps and in the abdomen than the men. The level of body fat dimorphism increased during the analysed period, reaching its highest values in adolescence. In adults, the level of dimorphism decreased with age, reaching the lowest values in the oldest group. Importantly, in both the 32–34- and 50-year-olds, men had greater body fat under the scapula and in the abdomen (Fig. 3). These results appear to confirm the observations of the researchers mentioned earlier.
It is known that body fat decreases in both sexes between the ages of 1 and 6, and then increases more rapidly in girls and to a lesser extent, in boys. During puberty, an even greater contrast in the pattern of body mass gain is evident between girls and boys. In this period, girls experience primarily increased body fat, with a slight increase in lean mass, while for boys, the opposite phenomenon is observed. These differences are primarily due to steroid hormone levels. In adults, women exhibit greater lower limb fat than men, with similar levels of upper limb and trunk fat (Wells, 2007). Therefore, in our study, we found that the level of dimorphism in body fat began to decrease after puberty. The increase in abdominal fat in males is also consistent with the observations of other authors. In research conducted in the Netherlands, it was shown that males accumulate abdominal fat after puberty (Seidell et al., 1988). Similar results were obtained in Japan, where researchers demonstrated that post-pubertal men accumulate abdominal fat 2.5 times more intensely than pre-menopausal women. Visceral fat accumulation in women increases only at the onset of menopause (Kotani et al., 1994). In our study, the increased abdominal fat in the men may have been due to the fact that the examined women were just entering the phase of menopause.
In our research, we used arm strength measurements to analyse ontogenetic changes in physical fitness among males and females in terms of sex differences (this measurement is considered one of the best biomarkers (predictors) related to the aging process with regard to the musculoskeletal system (Rezaei, 2024). We noted that the males had greater strength in their stronger arm than the females. The differences between the sexes were smallest in the youngest age group, increasing with age up to 32–34 years. In the oldest participants, these differences slightly decreased (Fig. 1). Similar results were achieved in the USA for research carried out among adults aged 18–85. It was demonstrated that men dominated in this trait throughout the analysed period, and the strength of both the dominant and non-dominant arms decreased with age. However, sex differences remained similar until age 70, and their reduction was observed later than in our study, around the age 75 (Wang, 2018). In the case of research conducted in the UK, it was also observed that both men and women had similar arm strength until puberty. After this period, the strength in men increased more rapidly, reaching its peak between the ages of 29 and 39. In women, the increase in arm strength was less rapid after puberty, reaching its peak between the ages of 26 and 42. In subsequent years, arm strength in women and men, as well as the sex-related differences, decreased (Dodds, 2014). This declining dissimilarity may be related to the fact that the aging process of muscle tissue, which results in a decrease in muscle mass and, consequently, muscle strength, begins—on average—around the age of 45 (Janssen, 2000). However, the process of muscle strength loss is greater in men than in women (men lose more muscle strength than the latter) (Goodpaster et al., 2006).
However, our observations regarding the level of sexual dimorphism measured using another criterion of physical fitness—explosive lower limb strength—showed that its level increased with age, reaching its highest level (Fig. 1) in young people, i.e., at the age of 17, after girls had completed puberty and before boys had finished growing in height.
Similar results were obtained in Spain, where the influence of selected factors (e.g. sex, age, level of physical activity) was analysed on the standing long jump distance. The study results indicated that sex played a significant role in differentiating this characteristic, which is likely due to differences in body composition (lean body mass content), muscle strength and neuromuscular as well as glycolytic efficiency (Mayhew et al., 1990). It is probable that age has significant impact on standing long jump distance in children, as their central nervous system is maturing, which may play a role in muscle strength. Anthropometric factors (i.e. body height and mass) and kinematic variables may also significantly influence performance of fitness tests in children (Fernandez-Santos et al., 2017). However, in adults, cognitive decline appears to take time to manifest itself in changes related to physical performance (i.e. slower movements or reduced strength due to the natural aging process) (Grosprêtre et al., 2018; Marin-Jimenez et al., 2024). Our study results seem to confirm these relationships and show that age-related changes in physical fitness dimorphism are similar to changes in overall body composition (body height, mass and their proportions – BMI), as well as shoulder width and upper arm circumference. Although there is greater trunk fat in adulthood (32–34 years) and in old age (50–52 years), males still clearly dominate the results of fitness tests.
Undoubtedly, the study has a few limitations. Its drawbacks include the small sample size and the restricted number of analysed anthropometric characteristics. The influence of socio-economic factors on dimorphism was also not taken into account, because the population came from areas with standard housing conditions, school facilities, and relatively homogeneous living conditions, presenting a certain population model characteristic of larger industrial centers in Poland (Bochenska and Chrzanowska, 1993). Its advantage, however, is that it is a longitudinal study conducted annually from age 6 and 8 to age to 18, then at age 30–32 and later, at 50–52 years of age.
Conclusions
Based on the conducted research and the assessment of sexual dimorphism in individuals aged 8, 13, 17, 32–34 and 50–52, it can be concluded that:
- Sexual dimorphism increased during development, reaching its highest level at the end of adolescence, particularly in terms of traits related to the differently developed fat and muscle distribution in both sexes.
- Final dimorphism, however, develops later (as confirmed by our studies of people aged 32–34) and concerns bone characteristics (body height, shoulder width), relative body mass and circumferences.
- In adulthood, at the threshold of aging (approximately at the age of 50), a significant reduction in the degree of sexual dimorphism is noted, which results from the nature of involutional changes that differ between the sexes.
References
Bocheńska, Z., Chrzanowska, M. (eds.). 1993. Rozwój somatyczny, fizjologiczny i psychiczny dzieci i młodzieży o różnym poziomie sprawności fizycznej w świetle badan długofalowych. Wydawnictwo Monograficzne nr 52, AWF Kraków.
Caman, O. K., Calling, S., Midlöv, P., Sundquist, J., Sundquist, K., & Johansson, SE. (2013). Longitudinal age – and cohort trends in body mass index in Sweden – a 24-year follow-up study. BMC Public Health, 13(1), 893. https://doi.org/10.1186/1471-2458-13-893
Chrzanowska, M., Gołąb, S., Bocheńska, Z., Panek, S. (1988). Dziecko krakowskie: poziom rozwoju biologicznego dzieci i młodzieży miasta Krakowa. Wydawnictwo Monograficzne nr 34, AWF Kraków.
Chrzanowska, M., Gołąb, S., Żarów, R., Sobiecki, J., & Brudecki, J. (2002). Dziecko Krakowskie 2000. Studia i Monografie Akademii Wychowania Fizycznego w Krakowie, 19.
Dodds, R. M., Syddall, H. E., Cooper, R., Benzeval, M., Deary, I. J., Dennison, E. M., Der, G., Gale, C. R., Inskip, H. M., Jagger, C., Kirkwood, T. B., Lawlor, D. A., Robinson, S. M., Starr, J. M., Steptoe, A., Tilling, K., Kuh, D., Cooper, C., & Sayer A. A. (2014). Grip strength across the life course: normative data from twelve British studies. PLoS One, 9(12), e113637. https://doi.org/10.1371/journal.pone.0113637
Drøyvold, W. B., Nilsen, T. I. L., Krüger, Ø., Holmen, T. L., Krokstad, S., Midthjell, K., & Holmen, J. (2006). Change in height, weight and body mass index: Longitudinal data from the HUNT Study in Norway. International Journal of Obesity, 30(6), 935–939. https://doi.org/10.1038/sj.ijo.0803178
Drozdowski, Z. (1998). Antropometria w wychowaniu fizycznym. Poznań: Akademia Wychowania Fizycznego.
Fernandez-Santos, J. R., Gonzalez-Montesinos, J. L., Ruiz, J. R., Jiménez-Pavón, D., & Castro-Piñero, J. (2017). Kinematic analysis of the standing long jump in children 6- to 12-years-old. Measurement in Physical Education and Exercise Science, 22(1), 70–78. https://doi.org/10.1080/1091367X.2017.1383913
Galloway, A., Stini, W. A., Fox, S. C., & Stein, P. (1990). Stature loss among an older United States population and its relation to bone mineral status. American Journal of Physical Anthropology, 83(4), 467–476. https://doi.org/10.1002/ajpa.1330830408
Gołąb, S., Cadel, K., Kurnik, G., Sobiecki, J., Żarów, R. (1993). Biologiczne i społeczne uwarunkowania zmienności przebiegu rozwoju fizycznego dzieci i młodzieży z Nowej Huty. Wydawnictwo Monograficzne nr 53, AWF Kraków.
Gołąb, S., Chrzanowska, M., Sobiecki, J., Żarów, R., Kościuk, T., Brudecki, J., Matusik, S., Pałosz, J., Gwardjak, T., Suder, A., & Cadel, K. (2003). Dziecko Krakowskie 2000. Sprawność fizyczna i postawa ciała dzieci i młodzieży miasta Krakowa. Studia i Monografie nr 22, AWF Kraków.
Goodpaster, B. H., Park, S. W., Harris, T. B., Kritchevsky, S. B., Nevitt, M., Schwartz, A. V., Simonsick, E. M.,Tylavsky, F. A., Visser, M., & Newman, A. B. (2006). The loss of skeletal muscle strength, mass, and quality in older adults: the health, aging and body composition study. The Journals of Gerontology Series A: Biological Sciences and Medical Sciences, 61(10), 1059–1064. https://doi.org/10.1093/gerona/61.10.1059
Greil, H., & Lange, E. (2007). Sexual dimorphism from birth to age 60 in relation to the type of body shape. Anthropologischer Anzeiger, 61–73.
Greil, H. (2006). Patterns of sexual dimorphism from birth to senescence. Collegium Antropologicum, 30(3), 637–641.
Grosprêtre, S., Ufland, P., & Jecker, D. (2018). The adaptation to standing long jump distance in parkour is performed by the modulation of specific variables prior and during take-off. Movement & Sport Sciences – Science & Motricité, 100(2), 27–37. https://doi.org/10.1051/sm/2017022
Hägg, S., & Jylhävä, J. (2021). Sex differences in biological aging with a focus on human studies. eLife, 10, e63425. https://doi.org/10.7554/eLife.63425
Janssen, I., Heymsfield, S. B., Wang, Z., & Ross, R. (2000). Skeletal muscle mass and distribution in 468 men and women aged 18–88 yr. Journal of Applied Physiology, 89(1), 81–88. https://doi.org/10.1152/jappl.2000.89.1.81
Jasicki, B. (1938). Dynamika rozwoju męskiej młodzieży z Krakowa. Prace i Materiały Antropologiczne. PAU Kaków, II.
Jasicki, B. (1948). Dalsze badania nad dynamiką rowojową młodzieży szkolnej. Prace i Materiały Antropologiczne. PAU Kaków, II.
Kotani, K., Tokunaga, K., Fujioka, S., Kobatake, T., Keno, Y., Yoshida S., Shimomura I., Tarui S., & Matsuzawa Y. (1994). Sexual dimorphism of age-related changes in whole-body fat distribution in the obese. International Journal of Obesity and Related Metabolic Disorders, 18(4), 207–202.
Kowal, M., Cichocka, B. A., Woronkowicz, A., Pilecki, M. W., Sobiecki, J., & Kryst Ł. (2011) Międzypokoleniowe zmiany w budowie ciała i akceleracja pokwitania u dzieci i młodzieży w wieku 7–15 lat z populacji wielkomiejskiej w świetle uwarunkowań psychosocjalnych. In: Kowal, M., & Cichocka, B. A. Monografie nr 5, AWF Kraków.
Kowal, M., Kryst, Ł., Sobiecki, J., & Woronkowicz, A. (2013). Secular trends in body composition and frequency of overweight and obesity in boys aged 3–18 from Krakow, Poland, within the last 30 years (from 1983 to 2010). Journal of Biosocial Science, 45, 111–134. https://doi.org/10.1017/S0021932012000284
Kryst, Ł., Żegleń., M., Kowal., M., & Woronkowicz, A. (2023). Time trends (2010–2020) in skinfolds thickness in children and adolescents, with different BMI status, from Kraków (Poland). Anthropologischer Anzeiger, 80(2), 135. https://doi.org/10.1127/ANTHRANZ/2022/1552
Larson, L. A. (1974). Fitness, Health, and Work Capacity: International Standards for Assessment. New York: Macmillan.
Marin Jimenez, N., Perez Bey, A., Cruz Leon, C., Conde Caveda, J., Segura Jimenez, V., Castro Piñero, J., & Cuenca Garcia, M. (2024). Criterion related validity and reliability of the standing long jump test in adults: The Adult Fit project. European Journal of Sport Science, 24(9), 1379–1392. https://doi.org/10.1002/ejsc.12182
Mayhew, J. L., & Salm, P. C. (1990). Gender differences in anaerobic power tests. European Journal of Applied Physiology and Occupational Physiology, 60(2), 133–138. https://doi.org/10.1007/BF00846033
Nooyens, A. C., Visscher, T. L., Verschuren, W. M., Schuit, A. J., Boshuizen, H. C., van Mechelen, W., & Seidell, J. C. (2009). Age, period and cohort effects on body weight and body mass index in adults: The Doetinchem Cohort Study. Public Health Nutrition, 12(6), 862–870. https://doi.org/10.1017/S1368980008003091
Perenc, L., & Radochońska, A. 2004. Dymorfizm płciowy wybranych cech antropometrycznych u dzieci i młodzieży rzeszowskiej w wieku 3−18 lat badanych w latach 1978–2004. Przegląd Medyczny Uniwersytetu Rzeszowskiego i Narodowego Instytutu Leków w Warszawie, 10(1), 38–49.
Peter, R. S., Fromm, E., Klenk, J., Concin, H., & Nagel, G. (2014). Change in Height, Weight, and body mass index: Longitudinal data from A ustria. American Journal of Human Biology, 26(5), 690–696. https://doi.org/10.1002/ajhb.22582
Rezaei, A., Bhat, S. G., Cheng, C. H., Pignolo, R. J., Lu, L., & Kaufman, K. R. (2024). Age-related changes in gait, balance, and strength parameters: A cross-sectional study. Plos one, 19(10), e0310764. https://doi.org/10.1371/journal.pone.0310764
Seidell, J. C., Oosterlee, A., Deurenberg, P., Hautvast, J. G., & Ruijs, J. H. (1988). Abdominal fat depots measured with computed tomography: effects of degree of obesity, sex, and age. European Journal of Clinical Nutrition, 42(9), 805–815.
Spring, B. A., Woronkowicz, A., Żarów, R., & Kowal, M. (2024). Age at pubarche and the risk of developing cardiometabolic complications among men aged 50–52 from the Kraków Longitudinal Study. Anthropological Review, 87(1), 11–31 https://doi.org/10.18778/1898-6773.87.1.02
Sterkowicz, S., & Żak, S. 2010. Dymorfizm płciowy elity osób uprawiających piłkę siatkową. Journal of Kinesiology and Exercise Sciences, 20(52), 77–84.
Wang, Y. C., Bohannon, R. W., Li, X., Sindhu, B., & Kapellusch, J. (2018). Hand-grip strength: normative reference values and equations for individuals 18 to 85 years of age residing in the United States. Journal of Orthopaedic & Sports Physical Therapy, 48(9), 685–693. https://doi.org/10.2519/jospt.2018.7851
Wells, J. C. (2007). Sexual dimorphism of body composition. Best Practice & Research Clinical Endocrinology & Metabolism, 21(3), 415–430. https://doi.org/10.1016/j.beem.2007.04.007
Wolański, N. 2006. Rozwój biologiczny człowieka. PWN Warszawa.
Woronkowicz, A., Cichocka, B. A., Kowal, M., Kryst, Ł., & Sobiecki, J. (2012). Physical development of girls from Krakow in the aspect of socioeconomical changes in Poland (1938–2010). American Journal of Human Biology, 24(5), 626–632. https://doi.org/10.1002/ajhb.22283
Xiao, Z., Tan, Z., Shang, J., Cheng, Y., Tang, Y., Guo, B., Gong, J., & Xu, H. (2020). Sex-specific and age-specific characteristics of body composition and its effect on bone mineral density in adults in southern China: a cross-sectional study. BMJ Open, 10(4), e032268.
Żarów, R. (2001). Prognozowanie dorosłej wysokości ciała chłopców : model własny i analiza porównawcza innych metod. Studia i Monografie nr 17, Akademia Wychowania Fizycznego w Krakowie.
Żarów, R., Brudecki, J., Chrzanowska, M., Gołab, S., Kowal, M., Matusik,S., Sobiecki, J., & Woronkowicz, A. (2006). Budowa ciała i aktywność fizyczna osób dorosłych a ich rozwój biologiczny w okresie dziecięcym i młodzieńczym (pod red. R. Żarowa). Studia i Monografie nr 36, AWF w Krakowie.
Żarów, R., Żegleń, M., Woronkowicz, A., Spring, B., Kowal, M., & Matusik, S. (2024). Changes in physical fitness and body build of women and men surveyed in 2004 and 2022 – A longitudinal study. American Journal of Human Biology, 36(8), e24066. https://doi.org/10.1002/ajhb.24066
Żegleń, M., Kryst, Ł., Kowal., M., & Woronkowicz, A. (2020). Changes in physical fitness among preschool children from Kraków (Poland) from 2008 to 2018. Journal of Physical Activity and Health, 17(10), 987–994. https://doi.org/10.1123/jpah.2020-0199
Final information
Acknowledgments
The authors would like to thank all participants for taking part in the research.
Author contributions
All participated in the conducted research, RŻ was responsible for the concept and design of the study, critical revision of the article, and final approval of the article, MK wrote the article, AW analysed data and conducted statistical analyses.
Ethics Statement
All examinations were conducted with the written, informed consent of the parents of minor children and adult participants. Approval was also obtained from the Bioethics Committee at the District Medical Chamber in Kraków for the study in 2022 (Consent No. 65/KBL/OIL dated April 11, 2022). All procedures contributing to the study were in accordance with the ethical standards of the relevant national and institutional human research committees and with the 1975 Declaration of Helsinki, as revised in 2008.
Data availability statement
Data are available from the corresponding author on reasonable request.
Financial disclosure
The research was funded under Grant No. 3P05D 001 24 financed by the Scientific Research Committee (Ministry of Science and Higher Education) and from the Ministry of Science and Higher Education programme ‘Regional Initiative of Excellence’ in 2019–2022 (Project No. 022/RID/ 2018/19) – internal number at University: 35/PB/RID/2022).
Conflict of interest
None to declare.
Corresponding Author
Ryszard Żarów, Department of Anthropology, University School of Physical Culture of Kraków, Jana Pawła II 78, 31-571 Kraków, Poland, phone: 693741775; e-mail: wazarow@cyf-kr.edu.pl; ryszard.zarow@awf.krakow.pl