Estimation of sex and assessment of age based on morphological variations of the atlas vertebra (C1) using Cone Beam Computed Tomography: A retrospective study
 https://orcid.org/0009-0001-7885-9910
Nitte (Deemed to be University), AB Shetty Memorial Institute of Dental Sciences, Department of Oral Medicine and Radiology, Mangalore 575018, India
https://orcid.org/0000-0002-6214-1381
Nitte (Deemed to be University), AB Shetty Memorial Institute of Dental Sciences, Department of Oral Medicine and Radiology, Mangalore 575018, India
https://orcid.org/0000-0002-5744-9322
Nitte (Deemed to be University), AB Shetty Memorial Institute of Dental Sciences, Department of Oral Medicine and Radiology, Mangalore 575018, India
https://orcid.org/0009-0008-6375-9926
Nitte (Deemed to be University), AB Shetty Memorial Institute of Dental Sciences, Department of Oral Medicine and Radiology, Mangalore 575018, India
Abstract
Background
The atlas (C1) vertebra joins the cervical column to the cranial base and differs anatomically from other cervical vertebrae. Skeletal analysis may provide the only way to assess biological sex and age in poorly preserved and decomposed remains to estimate their biological profile. It is thus essential that methods are devised that allow such estimates from a wide range of bones.
Aim
This study applies Cone Beam Computed Tomography (CBCT) to evaluate whether the C1 vertebrae can be used in estimating age and sex.
Materials and methods
CBCT of 61 male and 61 female subjects from South India with an age range of 20-60 years were included in the study, and C1 vertebrae were measured using axial and coronal sections. Data were analysed to generate an equation to predict age according to independent variables using linear regression, while discriminant analysis was used to derive an equation that classifies the values into either biological sex.
Results
Male subjects showed higher maximum anteroposterior diameter, maximum transverse diameter, and the distance between the base of the skull and the anterior tubercle than females (p=0.001). The highest standard error for males was observed in the maximum anteroposterior diameter. The base of the skull to the anterior tubercle had the highest standard error among female subjects. The base of skull to posterior tubercle had the lowest standard error for males, while the angulation from the transverse to the anterior tubercle had the least standard error for females. The accuracy of sex classification was 89.3%. However, parameters did not demonstrate sufficient reliability for age estimation.
Conclusion
The presented parameters may be used for sex determination in forensic identification and other medico-legal practices. In contrast, these parameters are not reliable for age estimation in our sample.
Keywords: forensic identification, forensic anthropology, morphometrics, vertebral morphology
Introduction
When examining unidentified skeletal remains, sex and age estimation are crucial components of constructing a biological profile. According to studies on sex prediction, the skull and pelvic bones have a high accuracy rate (Sertel-Meyvaci et al. 2024). Yet, due to a range of circumstances in the burial site or other occurrences, like disarticulation, scattering, and commingling, skeletal remains discovered in archaeological or forensic contexts are frequently damaged or lacking. The development of techniques that enable the determination of sex and age from a variety of skeletal components is crucial, especially when dental elements are missing in the exhumed or decomposed remains (Marlow & Pastor, 2011). While major bones (such as the skull, pelvis, femur) are frequently recovered at crime scenes, where the vertebrae are also discovered, they may have potential in biological profile reconstruction (Sertel-Meyvaci et al., 2024; Singla et al., 2015). In many situations, including mass disasters, vertebrae are often best-preserved skeletal bones (Hora & Sládek, 2018). The atlanto-occipital joint, where the occipital bone articulates with the first cervical vertebra, the atlas (C1), permits head motions. Because of its unique shape, it may be easily identified from the other vertebrae. Since vertebral dimension measurements are thought to be some of the most accurate indicators of sex, following pelvic measurements (Hora & Sládek, 2018), in this study we focus on the C1 atlas.
With the advent of 3D Cone Beam Computed Tomography (CBCT) imaging, concomitant high-resolution images allow accurate and reproducible analysis of the morphometric parameter of skeletal structures overcoming the limitations of 2D imaging, along with true 1:1 anatomic representation and economical advantage when compared to Computed Tomography (CT) and/or 2D imaging (MacDonald & Telyakova, 2024). The C1 atlas vertebrae can be clearly visualised in a 3D full Field of View (FOV) maxillofacial CBCT scans (Oliveira, 2025), which are the imaging mode in our study. The aim is to analyse whether CBCT scans of C1 vertebrae can be useful in age and sex estimation, especially in forensic contexts.
Materials and methods
Ethics clearance for this study was obtained from the AB Shetty Memorial Institute of Dental Sciences Institutional Ethics Committee (Ref. No. ETHICS/ABSMIDS/594/2025). Full CBCT FOV images spanning the period of April 2024 to April 2025 were obtained from the archives of the Department of Oral Medicine and Radiology at our institution. The Department of Oral Medicine and Radiology uses the CBCT unit Planmeca Promax 3D Mid variant. Images for 122 subjects were obtained and categorised into two groups: 61 males (mean age 36.1 ± 13.7 years) and 61 females (mean age 35.4 ± 12.9 years), constituting age ranging from 20 to 60 years. All these subjects met the inclusion criteria: i.e. having full FOV images and falling in the 20–60 years age range. Patients with history of mandibular fractures, and scans with errors, metal artifacts, and/or other pathology were excluded from the study. Planmeca Promax 3D Mid software was used to view the CBCT images.
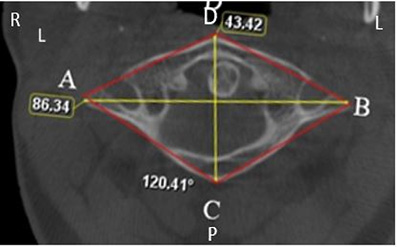
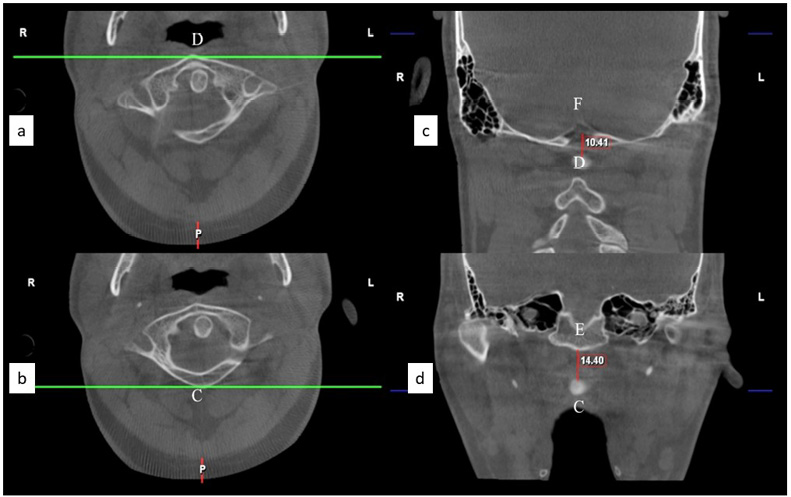
Measurements of the atlas and from the base of the skull were taken using the axial and coronal sections in the CBCT images (Table 1; Figures 1–2). The distance in millimetres between the axial sections for the parameter AB represents the maximum transverse width of the atlas vertebra and CD represents the maximum anteroposterior width of the atlas vertebra. Subsequently, the distance in millimetres in the coronal section the parameter DF represents the vertical distance from the anterior tubercle to the base of the skull and CE represents the vertical distance from the posterior tubercle to the base of the skull. Also angle ACB and angle ADB were measured.
The data were analysed using SPSS for Windows v. 26.0, IBM Corp., Armonk, NY. Sexes were compared using discriminant analysis. Linear regression was used to generate the equation predicting age according to independent variables. An equation classifying values into either sex was obtained using discriminant analysis. p ≤ 0.05 was the level of statistical significance.
| SL NO | Landmark | Description |
|---|---|---|
| 1. | Landmark A | The most lateral point of the right transverse processes |
| 2. | Landmark B | The most lateral point of the left transverse processes |
| 3. | Landmark C | Most anterior point on the anterior tubercle |
| 4. | Landmark D | Most posterior point on the posterior tubercle |
| 5. | Landmark E | Base of the skull-anterior in line with C |
| 6. | Landmark F | Base of the skull-posterior in line with D |
Results
Sex comparison
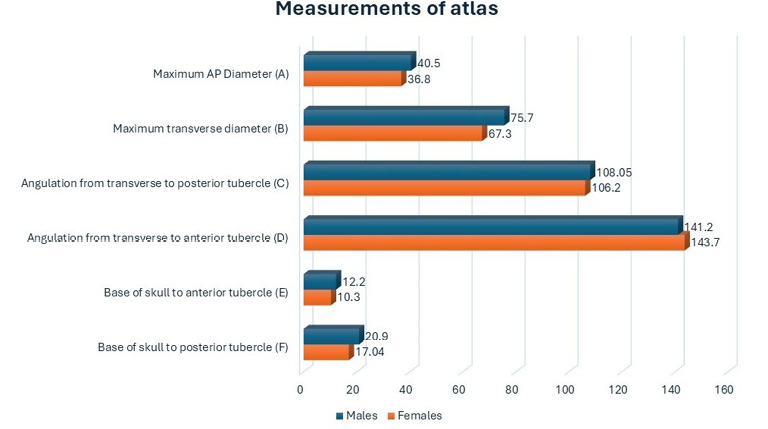
When comparing the sexes, for morphometric measurements in millimetres (mm) scale, the male participants demonstrated significantly higher values for maximum anteroposterior diameter (40.5 ± 2.7 mm vs. females 36.8 ± 3.9 mm; p = 0.001), maximum transverse diameter (75.7 ± 4.5 mm vs. females 67.3 ± 4.1 mm; p = 0.001), and distance from the base of the skull to the anterior tubercle (median 11.6 mm vs. females 10.5 mm; p = 0.001) than the female participants. Other anatomic parameters were found to be comparable between males and females (Table 2; Figure 3).
| Parameter | Males | Females | p value |
|---|---|---|---|
| Maximum AP Diameter (CD); mean ± sd | 40.5 ± 2.7 | 36.8 ± 3.9 | p = 0.001* |
| Maximum transverse diameter (AB); mean ± sd | 75.7 ± 4.5 | 67.3 ± 4.1 | p = 0.001* |
| Angulation from transverse to posterior tubercle (ACB); mean ± sd | 108.05 ± 7.4 | 106.2 ± 8 | p = 0.19 |
| Angulation from transverse to anterior tubercle (ADB); median (IQR) | 142.1 (136–146.3) | 142.4 (139.6–149.1) | p = 0.09 |
| Base of skull to anterior tubercle (DF); median (IQR) | 11.6 (10.2–13.9) | 10.5 (8.2–11.9) | p = 0.001† |
| Base of skull to posterior tubercle (CE); median (IQR) | 17.6 (15.2–21.2) | 16 (13.6–19.8) | p = 0.06 |
sd – standard deviation; *statistically significant using unpaired t-test and †Mann-Whitney U test, p<0.05 statistically significant
Age estimation
In age estimation, p=0.63 indicated that the model with the parameters used in the regression analysis was not a good predictor of age. Only 3.6% of the variance was explained by the model, which is low (Table 3). The lowest standard error of 0.08 was observed in the base of the skull to posterior tubercle, and the variable with the highest standard error was the maximum anteroposterior diameter. It was found that none of the variables in the present model had any significant impact in the prediction of age.
| Sum of Squares | df | Mean Square | F | p value | R | R2 | SEE | |
|---|---|---|---|---|---|---|---|---|
| Regression | 779.35 | 6 | 129.8 | 0.726 | p = 0.63 | |||
| Residuals | 20576.6 | 115 | 178.9 | NS | 0.191 | 0.036 | 13.3 | |
| Total | 21356 | 121 |
NS – not significant, SEE – Standard Error of the Estimate
The equation derived for overall age estimation was as below:
Age (overall) = 102.77 – 0.828 × max. anteroposterior width (CD) + 0.33 × maximum transverse width (AB) – 0.144 × angulation from transverse to posterior tubercle (ACB) – 0.286 × angulation from transverse to anterior tubercle (ADB) – 0.08 × base of skull to anterior tubercle (DF) – 0.065 × base of the skull to posterior tubercle (CE).
The difference between actual age and predicted age by the equation (standard error of estimate, SEE), was 13.3 years (Table 3). A p=0.3 (males) and p=0.5 (females) indicated that the model with the variables used in the regression analysis was not a good predictor of age. Only 10% and 9.1% of the variance was explained by the model for males and females, which was very low (Table 4). Base of skull to posterior tubercle had the lowest SEE for males, while the angulation from the transverse to the anterior tubercle had the lowest SEE for females. The highest SEE for males was observed in the maximum anteroposterior diameter, while the base of the skull to the anterior tubercle had the highest SEE among female participants (Table 5).
| Sum of Squares | df | Mean Square | F | p value | R | R2 | SEE | ||
|---|---|---|---|---|---|---|---|---|---|
| Males | Regression | 1192.1 | 6 | 198.6 | 1.06 | p = 0.3 | 0.32 | 0.1 | 13.6 |
| Residuals | 10106.1 | 54 | 187.1 | ||||||
| Total | 11298.3 | 60 | |||||||
| Females | Regression | 916.5 | 6 | 152.7 | 0.903 | p = 0.5 | 0.302 | 0.091 | 13 |
| Residuals | 9137.8 | 54 | 169.2 | ||||||
| Total | 10054.3 | 60 |
SEE – Standard Error of the Estimate
| B | SEE | t | p value | |
|---|---|---|---|---|
| Constant | 102.77 | 67.87 | 1.5 | p = 0.133 |
| Maximum AP Diameter (CD) | -0.828 | 0.607 | -1.3 | p = 0.17 |
| Maximum transverse diameter (AB) | 0.33 | 0.35 | 0.92 | p = 0.35 |
| Angulation from transverse to posterior tubercle (ACB) | -0.144 | 0.3 | -0.4 | p = 0.64 |
| Angulation from transverse to anterior tubercle (ADB) | -0.286 | 0.2 | -1.1 | p = 0.24 |
| Base of skull to anterior tubercle (DF) | -0.08 | 0.4 | -0.17 | p = 0.8 |
| Base of skull to posterior tubercle (CE) | -0.065 | 0.08 | -0.8 | p = 0.4 |
SEE – Standard Error of the Estimate
Table 6 lists coefficients for variables used in the regression model for age estimation, which was as follows:
Age (Males) = 231.06 – 1.49 (CD) + 0.75 (AB) – 0.58 (ACB) – 0.83 (ADB) – 0.8 (DF) – 0.053 (CE)
Age (Females) = 71.34 – 0.968 (CD) + 0.065 (AB) – 0.073 (ACB) – 0.061 (ADB) + 1.0 (DF) +0.112 (CE)
The SEE was 13.6 years. The observed difference between actual and predicted age (~13 years) is consistent with this expected level of error.
| B | SEE | t | p value | ||
|---|---|---|---|---|---|
| Males | Constant | 231.06 | 172.5 | 1.3 | p= 0.18 |
| Maximum AP Diameter (CD) | -1.49 | 1.5 | -0.9 | p = 0.33 | |
| Maximum transverse diameter (AB) | 0.75 | 0.79 | 0.94 | p = 0.34 | |
| Angulation from transverse to posterior tubercle (ACB) | -0.58 | 0.77 | -0.74 | p= 0.45 | |
| Angulation from transverse to anterior tubercle (ADB) | -0.83 | 0.57 | -1.44 | p = 0.15 | |
| Base of skull to anterior tubercle (DF) | -0.8 | 0.65 | -1.2 | p = 0.21 | |
| Base of skull to posterior tubercle (CE) | -0.053 | 0.08 | -0.6 | p = 0.54 | |
| Females | Constant | 71.34 | 76.2 | 0.93 | p = 0.35 |
| Maximum AP Diameter (CD) | -0.968 | 0.66 | -1.4 | p = 0.14 | |
| Maximum transverse diameter (AB) | 0.065 | 0.5 | 0.12 | p= 0.9 | |
| Angulation from transverse to posterior tubercle (ACB) | -0.073 | 0.3 | -0.21 | p = 0.83 | |
| Angulation from transverse to anterior tubercle (ADB) | -0.061 | 0.2 | -0.21 | p = 0.8 | |
| Base of skull to anterior tubercle (DF) | 1.006 | 0.7 | 1.2 | p= 0.2 | |
| Base of skull to posterior tubercle (CE) | 0.112 | 0.3 | 0.33 | p= 0.7 |
Sex estimation
To compute the overall classification accuracy for sex estimation, 56 of the 61 male individuals and 53 of the 61 female subjects were correctly classified. Consequently, in total, 109 out of 122 patients were accurately classified. Hence, 89.3% of the participants were accurately classified by the discriminant function based on their sex as below:
Total accuracy = (56 men + 53 females) / 122 total cases = 109 / 122 = 0.8934 (89.34%).
For sexual dimorphism, the eigenvalue of 1.183 in the present analysis suggested that this function was effective in classifying values based on sex. In addition, a canonical correlation of 0.736 suggested that the canonical variates were effective in classifying values in groups (males and females). A Wilk’s Lambda of 0.458 indicated that the discriminant explained a moderate proportion of variance and was moderately effective in classifying values (Table 7).
The discriminant functions at group centroids for sex estimation were -1.079 for females and 1.079 for males. A discriminant score less than 0 classifies the values as females, and a discriminant score more than 0 classifies the values as males (eigenvalue = 1.183, correlation = 0.736, Wilks’ Lambda = 0.458, p=0.001).
| Variables | Coefficients | Wilki’s Lambda | Constant |
|---|---|---|---|
| Maximum AP Diameter (CD) | 0.057 | 0.458 | -13.289 |
| Maximum transverse diameter (AB) | 0.218 | ||
| Angulation from transverse to posterior tubercle (ACB) | -0.043 | ||
| Angulation from transverse to anterior tubercle (ADB) | -0.007 | ||
| Base of skull to anterior tubercle (DF) | 0.084 | ||
| Base of skull to posterior tubercle (CE) | 0.007 |
The canonical functional discriminant equation was (Table 7):
Sex = 0.057 (CD) + 0.218 (AB) – 0.043 (ACB) – 0.007 (ADB) + 0.084 (DF) – 0.007 (CE) – 13.29.
The classification accuracy of males (n=61) was: predicated males 56 (91.8%), predicated females 5 (8.2%). For females (n=61), predicated males were 8 (13.1%), while predicated females were classified in 53 cases (86.9%).
Discussion
The C1 vertebra is situated in a crucial region near the medulla oblongata‘s essential centres. It does not have a centrum, or vertebral body. With a longer posterior arch and a short anterior arch connecting them in the front, the vertebral arch has changed to create a thick lateral mass on each side. The lower articular surface is rounded or oval and almost flat, whereas the upper is kidney-shaped and concave (Thakur et al., 2022). The atlantal ring is formed by the superior and lateral masses on each side, as well as the anterior and posterior arches of the atlas. Three-fifths of the atlantal ring‘s circumference is made up of the posterior arch. A broad groove for the vertebral artery and venous plexus is located directly beneath the superior surface of the posterior arch. The ligamentum flava attaches to the inferior border, while the posterior atlanto-occipital membrane attaches to the superior border. A simple spinous process that has been roughened to accommodate ligamentum nuchae attachment is the posterior tubercle (Muralimohan et al., 2009).
The present study describes CBCT-derived morphometric parameters of the C1 vertebra to develop discriminant and regression functions for sex and age estimation in an adult population aged 20–60 years, which can be used in forensic anthropology. In our study, maximum anteroposterior diameter, maximum transverse diameter, and distance from base of skull to anterior tubercle were significantly larger in males. The discriminant function had high accuracy (canonical correlation = 0.736, Wilks’ Lambda = 0.458, group centroids ±1.079), whereas the age prediction model explained very little variance (~3.6 % overall), with large standard errors (~13 years) and were not statistically significant. In this study, in the linear dimensions (parameters AB, CD, and DF) there were notable sex differences, with males consistently having greater measurements than females. Although total size varied by sex, structural orientation and relative angulation were constant, as evidenced by the lack of significant differences in angular measurements (ACB and ADB) and posterior distance (CE). These results demonstrate sexual dimorphism in several C1 vertebral morphometric parameters, which most likely reflects variations in male and female skeletal development and biomechanical adaptation.
In a previous study by Marino et al. (1995), examining 100 dry atlases, sex determination was examined using discriminant function analysis and it could be made with 77–85%. Similarly, we analysed 122 C1 vertebrae for the estimation age and sex, showing that sample size >100 is needed for successful sex estimation. In a study by Padovan et al. (2020), atlas measurements suggested sexual dimorphism, with logistic regression based on two measurements achieving 81% success in a Brazilian population. Sertel-Meyvaci et al. (2024) examined 22 CBCT atlas parameters in 290 individuals of Turkish population and achieved sex classification accuracies in the range of 82–91 %. They also found most dimensions significantly larger in males (Sertel-Meyvaci et al. 2024).
Our study was performed on a South Indian population, and we found that the cross-validated classification accuracy for sex was 89.3%. Our study values also depicted increased mean values for male subjects in parameters AB, CD, and DF. The systematic review by Rohmani et al. (2021) showed that vertebrae (especially cervical vertebrae including atlas and axis) tend to display measurable sexual dimorphism, though prediction accuracy varies across populations, vertebral levels and measurement types. In a study conducted by Poodendan et al. (2023), the C1 vertebrae of identified skeletons (n = 104, males [n, 54], females [n, 50]) accurately predicted sex, which our findings also confirm. Future research should be aimed to validate our model using a larger, independent sample from the same population to improve reliability and forensic applicability. Hence, it may be derived from this research that these C1 measurements may be applied only in sex estimation for forensic utility.
The results of the regression models for age prediction performed poorly in our study. The C1 morphometric characteristics only described a very small percentage of the age variance, according to the coefficient of determination (R2 = 3.6%). More significantly, SEE of 13 years is above permissible limits for forensic age assessment as the difference is incredibly high. This kind of inaccuracy renders the derived equations impractical and untrustworthy for use in real time forensic applications. This implies that the specific C1 morphometric characteristics employed in this study are not appropriate predictors for determining an adult‘s chronological age. It is suggested that further research may be focused on population specific studies with larger sample size to attain a strong formula in support of these parameters for age estimation.
Conclusion
Accurate sex estimation is imperative for successful forensic identification, and the unique features of the atlas bone make it advantageous in sex estimation. Our findings demonstrated that the measurements of the maximum anteroposterior diameter, the maximum transverse diameter, and the distance between the base of the skull and the anterior tubercle were significantly higher among male participants when compared to female participants. Therefore, the current model (equation) accurately classified values into males and females.
However, the attempts to estimate chronological age from the same morphometric variables proved weak and unreliable. Thus, in forensic/archaeological contexts, atlas metrics may be valid for sex estimation when better bones are not available, but they should be supplemented by data for age estimation supported by research on a larger population-specific sample size.
References
Hora M., & Sládek V. (2018). Population specificity of sex estimation from vertebrae. Forensic Science International, 291, 279.e1–279.e12. https://doi.org/10.1016/j.forsciint.2018.08.015
MacDonald D., & Telyakova V. (2024). An overview of cone-beam computed tomography and dental panoramic radiography in dentistry in the community. Tomography, 10(8), 1222–1237. https://doi.org/10.3390/tomography10080092
Marino E. A. (1995). Sex estimation using the first cervical vertebra. American Journal of Physical Anthropology, 97(2), 127–133. https://doi.org/10.1002/ajpa.1330970205
Marlow E. J., & Pastor R. F. (2011). Sex determination using the second cervical vertebra – a test of the method. Journal of Forensic Sciences, 56, 165-169. https://doi.org/10.1111/j.1556-4029.2010.01543.x
Meyvaci S. S., Ankarali H., Bulut D. G., & Taskin B. (2024). Performances of different classification algorithms in sex determination from first cervical vertebra measurements. International Journal of Morphology, 42(5), 1439–1445. https://doi.org/10.4067/S0717-95022024000501439
Muralimohan S., Pande A., Vasudevan M. C., & Ramamurthi R. (2009). Suboccipital segment of the vertebral artery: A cadaveric study. Neurology India, 57(4), 447–452. https://doi.org/10.4103/0028-3886.55610
Oliveira M. L. (2025). Digital dental radiology and diagnostics – from 2D to 3D. Australian Dental Journal, 70(Suppl 1), S50–S66. https://doi.org/10.1111/adj.70024
Padovan L., Ulbricht V., Groppo F. C., Neto J. S., Andrade V. M., & Júnior L. F. (2019). Sexual dimorphism through the study of atlas vertebra in the Brazilian population. Journal of Forensic Dental Sciences, 11, 158–162. https://doi.org/10.4103/jfo.jfds_85_19
Poodendan C., Suwannakhan A., Chawalchitiporn T., Kasai Y., Nantasenamat C., Yurasakpong L., Iamsaard S., & Chaiyamoon A. (2023). Morphometric analysis of dry atlas vertebrae in a northeastern Thai population and possible correlation with sex. Surgical and Radiologic Anatomy, 45(2), 175–181. https://doi.org/10.1007/s00276-022-03076-6
Rohmani A., Shafie M. S., & Nor F. M. (2021). Sex estimation using the human vertebra: A systematic review. Egyptian Journal of Forensic Sciences, 11, 25. https://doi.org/10.1186/s41935-021-00238-2
Singla M., Goel P., Ansari M. S., Ravi K. S., & Khare S. (2015). Morphometric analysis of axis and its clinical significance—an anatomical study of Indian human axis vertebrae. Journal of Clinical and Diagnostic Research, 9(5), AC04. https://doi.org/10.7860/JCDR/2015/13118.5931
Thakur C., Nigam R., Singh T., Modi B. S., & Sharma S. (2022). Morphometric analysis of atlas vertebrae in northern population in India. International Journal of Academic Medicine and Pharmacy, 4, 667–670. https://doi.org/10.47009/jamp.2022.4.5.139
Final information
Contributions from individual authors
TSD was the lead researcher, performed the data collection, compilation and statistical analysis, provided materials for the study and wrote the manuscript; KR was the co-lead researcher, conceived the concept of the study and design and did critical revision of the manuscript for important intellectual content. Both VA and BM carried out revision of the article. All authors discussed the results and contributed to the final manuscript for publication.
Ethics Statement
Ethical clearance was obtained from the Institutional Ethics Committee of AB Shetty Memorial Institute of Dental Sciences (Ref. No. ETHICS/ABSMIDS/594/2025).
Data availability statement
Due to ethical restrictions on sharing patient data, the complete dataset cannot be made publicly available. Researchers may seek ethics approval and request access to anonymized data by contacting the corresponding author.
Financial Disclosure
None to declare.
Conflict of interest
None to declare.
Corresponding Author
Kumuda Rao, Nitte (Deemed to be University), AB Shetty Memorial Institute of Dental Sciences, Department of Oral Medicine and Radiology, Mangalore 575018, India, drkumudarao@yahoo.in