Assessment of the Internal Consistency of Two Polish References in Detecting Short Stature and Obesity in Children and Adolescents
 https://orcid.org/0000-0003-0509-1004
Public Health Department, The Children’s Memorial Health Institute, al. Dzieci Polskich 20, 04-730 Warsaw, Poland
https://orcid.org/0000-0003-3289-2878
Public Health Department, The Children’s Memorial Health Institute, al. Dzieci Polskich 20, 04-730 Warsaw, Poland
Abstract. In paediatric practice, growth references are used by doctors and nurses to evaluate a child’s growth status. We present an assessment of the internal consistency of two Polish references in detecting short stature and obesity in children and adolescents. Key diagnostic thresholds, the 3rd percentile for height and the 95th for Body Mass Index (BMI), were selected for comparison. Percentiles were calculated for hypothetical heights 0.2 cm lower than the third percentile of specific references and 0.1 units lower than the 95th percentile of specific references, in the case of height and BMI references, respectively. The z-scores were calculated and converted to percentiles. MS Excel was used. Around the 3rd percentile of height and the 95th percentile of BMI, there is a discrepancy in the Warsaw growth reference for measured height and BMI, respectively, and the calculated percentile. In the case of the Polish 2010 and 2012 growth references, a hypothetical height 0.2 cm below the third percentile of height-for-age reference yielded percentiles below 3 for all ages in both sexes. The Polish 2010 and 2012 growth references for measurements 0.1 units below the obesity threshold yielded percentiles of 94.69–94.86 in boys and girls. The Polish 2010 and 2012 growth references provide consistent and coherent calculation results for the 3rd percentile of height and the 95th percentile of BMI for children and adolescents aged 3–18 years.
Keywords: growth references, children, z-score, percentile
Introduction
The growth of a child is a crucial indicator of health (WHO 1995; Gelander 2006). Monitoring growth to identify health- or nutrition-related problems is a vital task in many medical areas in primary health care (Ministry of Health 2023). Growth references have practical significance as doctors and nurses use them in relation to individual children part of medical assessments evaluating growth status. In Poland, growth references based on a representative national sample of children and adolescents were first developed during OLAF and OLA studies and reported as the Polish 2010 and 2012 growth references for school-aged and preschool children, respectively (Kułaga 2011; 2013). However, references from the years 1996–1999, based on measurements of children from Poland’s capital city—hereinafter: “Warsaw growth references”/”Warsaw growth charts”—are still in use (Palczewska and Niedźwiedzka 2001). There are several key differences between the two reference systems, not only in the years of development (more recent vs older ones), population (whole country, including rural populations, vs capital city) but also the method of statistical elaboration (crude percentiles without accounting for data skewness vs LMS, which enables accounting for skew data distribution and smoothing reference curves) (Cole 1990). The biological data including anthropometry like weight, height, and Body Mass Index (BMI), often have asymmetric (skewed) distribution. Calculation of z-score, which is first step in determining the percentile is based on normal (Gaussian) distribution. This is why accounting for the skewed distribution of anthropometric data is crucial for creating accurate growth references. Table 1 provides a summary comparison of the two Polish growth reference systems.
| Warsaw growth references | Polish 2010 and 2012 growth references | |
|---|---|---|
| Years of development | 1996–1999 | 2007–2012 |
| Reference population | urban population – Warsaw children and youth | urban and rural – whole country population |
| Method of study subjects drawing | random sampling | random sampling |
| Age range | 0–18 years | 3–18 years |
| Sample size | 6,366 | 22,292 |
| Statistical method of percentile development | Crude percentiles (calculation without accounting for skewness) | LMS method for constructing normalized growth standards (Cole 1990) |
| z-score calculation | Based on mean and standard deviation, which does not account for skewness | Based on LMS parameters, a Box-Cox power transformation was used to normalize the data at each age (Cole 1990) |
| Percentile | Based on the z-score normal distribution | Based on the z-score normal distribution |
L = Box-Cox power; M = median; S = coefficient of variation.
Usually, a result of the measurement is marked on a growth chart (percentile chart). Medical calculators are becoming increasingly popular, and children’s growth assessment with a mathematical formula is possible using hospital information systems and online calculators: https://antek.exploreit.io/pl, https://nauka.czd.pl/kalkulator-2/, https://www.jakicentyl.pl/. These calculators use parameters of a growth reference system to calculate percentiles: mean and standard deviation (SD) or LMS if the reference used is constructed according to the LMS method (Cole 1990). A precise calculation of height, weight and BMI percentile is required. The z-score is calculated for this purpose, and based on normal distribution, the percentile associated with the calculated z-score is derived. These approaches are also applicable in scientific analyses, which usually involve processing significant volumes of growth data. It is important to note that different growth reference systems yield different results, which may be of significance in particular cases. This paper aims to provide evidence regarding noteworthy differences in height-for-age and BMI-for-age percentile calculation resulting from the application of two Polish growth references.
Materials and Methods
The internal consistency of calculation percentile values was compared between two reference ranges: 1) the Warsaw growth reference (Palczewska and Niedźwiedzka 2001), 2) the Polish 2010 and 2012 growth references (Kułaga 2011; 2013). Key diagnostic thresholds, the 3rd percentile for height and the 95th for BMI, were selected for comparison. The height-for-age percentiles were calculated for hypothetical heights 2 mm lower than the third percentile of the specific reference. The BMI-for-age percentiles were calculated for a hypothetical BMI 0.1 units lower than the 95th percentile of specific reference (Jodkowska et al. 2007; Kułaga 2011; 2013). The 95th percentile of BMI-for-age is considered to indicate the obesity threshold in childhood and adolescence (Mazur et al. 2024). In the case of the Warsaw growth reference, the following formula was used to calculate the z-score (z):
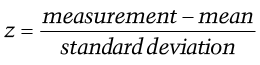 (1)
(1)
For the Polish 2010 and 2012 growth references, the formula for z-score calculation was:
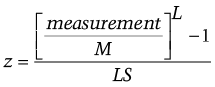 (2)
(2)
where L = Box-Cox power; M = median; S = coefficient of variation.
Finally, the obtained z-scores were converted to percentiles based on normal distribution using the NORM.S.DIST function and tabulated according to age and sex. All calculations were done using an MS Excel spreadsheet (Microsoft Corporation).
Results
For the Warsaw growth reference, a hypothetical height below the 3rd percentile yielded a calculated percentile above 3.0 for numerous age groups in both boys and girls (Table 2). In the case of the Polish 2010 and 2012 growth references, a hypothetical height 0.2 cm below the third percentile of height-for-age reference yielded percentiles below 3 (2.54–2.90) for all ages in both sexes (Table 2).
| The Warsaw growth reference | ||||||
|---|---|---|---|---|---|---|
| boys | girls | |||||
| Age (years) | The 3rd percentile (cm) | Hypothetical Height (cm) | Percentile calculated for hypothetical height | The 3rd percentile (cm) | Hypothetical Height (cm) | Percentile calculated for hypothetical height |
| 3 | 89.8 | 89.6 | 2.24 | 90.0 | 89.8 | 4.48 |
| 4 | 96.5 | 96.3 | 1.90 | 96.6 | 96.4 | 4.76 |
| 5 | 103.6 | 103.4 | 4.15 | 102.4 | 102.2 | 3.82 |
| 6 | 109.7 | 109.5 | 5.73 | 107.5 | 107.3 | 5.32 |
| 7 | 115.0 | 114.8 | 4.02 | 113.0 | 112.8 | 3.72 |
| 8 | 119.5 | 119.3 | 3.92 | 118.8 | 118.6 | 1.69 |
| 9 | 124.3 | 124.1 | 1.63 | 123.9 | 123.7 | 2.99 |
| 10 | 128.5 | 128.3 | 2.84 | 128.0 | 127.8 | 3.07 |
| 11 | 133.7 | 133.5 | 3.03 | 134.1 | 133.9 | 2.95 |
| 12 | 139.5 | 139.3 | 1.87 | 140.1 | 139.9 | 2.60 |
| 13 | 144.5 | 144.3 | 4.07 | 146.5 | 146.3 | 1.85 |
| 14 | 151.0 | 150.8 | 4.55 | 150.0 | 149.8 | 2.54 |
| 15 | 158.0 | 157.8 | 2.31 | 151.8 | 151.6 | 2.75 |
| 16 | 164.5 | 164.3 | 3.34 | 153.0 | 152.8 | 2.16 |
| 17 | 166.4 | 166.2 | 2.89 | 153.5 | 153.3 | 1.39 |
| 18 | 166.7 | 166.5 | 3.10 | 154.0 | 153.8 | 2.78 |
| The Polish 2010 and 2012 growth references | ||||||
| boys | girls | |||||
| 3 | 90.5 | 90.3 | 2.60 | 89.1 | 88.9 | 2.74 |
| 4 | 97.2 | 97.0 | 2.67 | 95.8 | 95.6 | 2.54 |
| 5 | 103.3 | 103.1 | 2.88 | 101.9 | 101.7 | 2.90 |
| 6 | 109.0 | 108.8 | 2.68 | 107.6 | 107.4 | 2.82 |
| 7 | 115.0 | 114.8 | 2.69 | 113.3 | 113.1 | 2.72 |
| 8 | 120.1 | 119.9 | 2.70 | 118.7 | 118.5 | 2.81 |
| 9 | 125.0 | 124.8 | 2.82 | 123.6 | 123.4 | 2.77 |
| 10 | 129.3 | 129.1 | 2.79 | 128.3 | 128.1 | 2.79 |
| 11 | 133.7 | 133.5 | 2.81 | 134.1 | 133.9 | 2.84 |
| 12 | 138.6 | 138.4 | 2.84 | 141.0 | 140.8 | 2.84 |
| 13 | 144.8 | 144.6 | 2.83 | 146.9 | 146.7 | 2.77 |
| 14 | 152.1 | 151.9 | 2.85 | 150.6 | 150.4 | 2.74 |
| 15 | 158.5 | 158.3 | 2.78 | 152.4 | 152.2 | 2.77 |
| 16 | 162.8 | 162.6 | 2.84 | 153.1 | 152.9 | 2.75 |
| 17 | 165.2 | 165.0 | 2.76 | 153.6 | 153.4 | 2.79 |
| 18 | 166.7 | 166.5 | 2.81 | 154.0 | 153.8 | 2.84 |
In the case of children and adolescent BMI obesity threshold, the Warsaw growth reference yielded a percentile over the 95th for measurements 0.1 units below the threshold for most ages in boys and all ages in girls. The Polish 2010 and 2012 growth references for measurements 0.1 units below the obesity threshold yielded percentiles of 94.69–94.86 in boys and girls (Table 3).
| The Warsaw growth reference | ||||||
|---|---|---|---|---|---|---|
| boys | girls | |||||
| Age (years) | The 95th percentile (kg/m2) | Hypothetical BMI (kg/m2) | Percentile calculated for hypothetical BMI | The 95th percentile (kg/m2) | Hypothetical BMI (kg/m2) | Percentile calculated for hypothetical BMI |
| 6 | 18.3 | 18.2 | 91.59 | 18.5 | 18.4 | 96.86 |
| 7 | 19.0 | 18.9 | 98.02 | 20.2 | 20.1 | 95.72 |
| 8 | 21.0 | 20.9 | 94.15 | 21.3 | 21.2 | 97.22 |
| 9 | 22.2 | 22.1 | 96.75 | 22.2 | 22.1 | 98.74 |
| 10 | 23.3 | 23.2 | 97.15 | 22.8 | 22.7 | 97.28 |
| 11 | 24.0 | 23.9 | 98.33 | 23.5 | 23.4 | 97.67 |
| 12 | 24.8 | 24.7 | 95.74 | 24.1 | 24.0 | 96.60 |
| 13 | 25.4 | 25.3 | 96.69 | 24.5 | 24.4 | 97.30 |
| 14 | 25.7 | 25.6 | 96.03 | 24.9 | 24.8 | 97.53 |
| 15 | 25.7 | 25.6 | 97.08 | 25.4 | 25.3 | 97.70 |
| 16 | 25.7 | 25.6 | 96.07 | 25.7 | 25.6 | 96.78 |
| 17 | 25.8 | 25.7 | 94.60 | 25.9 | 25.8 | 94.57 |
| 18 | 26.3 | 26.2 | 95.50 | 26.1 | 26.0 | 97.75 |
| The Polish 2010 and 2012 growth references | ||||||
| boys | girls | |||||
| 6 | 19.8 | 19.6 | 94.73 | 19.6 | 19.4 | 94.69 |
| 7 | 20.6 | 20.4 | 94.77 | 20.2 | 20.0 | 94.73 |
| 8 | 21.6 | 21.4 | 94.80 | 21.1 | 20.9 | 94.76 |
| 9 | 22.7 | 22.5 | 94.83 | 22.0 | 21.8 | 94.79 |
| 10 | 23.8 | 23.6 | 94.85 | 22.9 | 22.7 | 94.81 |
| 11 | 24.7 | 24.5 | 94.86 | 23.9 | 23.7 | 94.82 |
| 12 | 25.4 | 25.2 | 94.86 | 24.7 | 24.5 | 94.82 |
| 13 | 25.8 | 25.6 | 94.85 | 25.3 | 25.1 | 94.82 |
| 14 | 26.2 | 26.0 | 94.84 | 25.8 | 25.6 | 94.82 |
| 15 | 26.6 | 26.4 | 94.83 | 26.1 | 25.9 | 94.81 |
| 16 | 27.1 | 26.9 | 94.82 | 26.3 | 26.1 | 94.80 |
| 17 | 27.6 | 27.4 | 94.81 | 26.5 | 26.3 | 94.80 |
| 18 | 28.1 | 27.9 | 94.80 | 26.7 | 26.5 | 94.80 |
Discussion
Routine monitoring of children’s growth relies on age- and sex-specific reference intervals “where interest lies in the detection of extreme values, possibly indicating abnormality” (Wright and Royston 1997: 47). An example of such an abnormality is growth hormone deficiency, for which an auxological criterion, namely height below the third percentile for age and sex, is one of the requirements to qualify for the growth hormone programme in Poland (Ministry of Health 2024). From this perspective, the discrepancy between the results of height percentile calculations (percentile over 3) and the measurement result (below the third percentile), as presented in Table 2, is a major drawback, especially for systems using the Warsaw growth reference parameters (Palczewska and Niedźwiedzka 2001). A child could be wrongly disqualified from the growth hormone programme based on a height-for-age percentile calculated in this way. Fortunately, the more recent Polish growth reference system from 2010 and 2012 (Kułaga 2011; 2013) provides consistent and coherent results between height measurement below the third percentile and the result of percentile calculation.
The BMI by age and sex reference is currently the most widely used metric for estimating obesity among children and adolescents (Reilly et al. 2002). Monitoring a child’s BMI in relation to population-based reference is crucial in the era of the childhood obesity pandemic (González-Álvarez et al. 2020). Overestimating BMI percentiles across all age ranges in girls and the majority of ages in boys is viewed as a critical limitation of the Warsaw growth reference: when applied, it would categorize as obese those children who are not obese according to the 95th BMI percentile.
Both height-for-age reference and BMI-for-age reference are tools used in child growth and development monitoring. The tools should be accurate, meaning that the result obtained by a tool is a true or accepted value. Our analysis provides evidence that the Warsaw growth reference system is not accurate enough around the third percentile of height and the 95th percentile of BMI, while the Polish 2010 and 2012 growth references are accurate.
One limitation of the Polish 2010 and 2012 growth references is the lack of parameters for children under 3 years of age. Nevertheless, it is important to note that growth reference based on measurements taken from children who were not optimally fed in infancy, i.e. exclusively breastfed for at least 4 months, is now not recommended (Woynarowska et al. 2012). In many countries, including Poland, there are no available national growth references for infants and toddlers optimally fed in infancy. To solve this problem, the World Health Organization (WHO) Child Growth Standards for Children aged 0–5 years were adapted and used in over 100 countries (Woynarowska et al. 2012; de Onis et al. 2006). In 2011, recommendations for implementing the WHO growth standards were signed by the Committee of Human Development and the Committee of Anthropology of the Polish Academy of Sciences, the Main Board of the Polish Anthropological Society, the Institute of Mother and Child, and the Institute of Food and Nutrition (Woynarowska et al. 2012).
Conclusions
Around the 3rd percentile of height and the 95th percentile of BMI, there is a discrepancy in the Warsaw references for measured height and BMI and the calculated percentile. The Polish 2010 and 2012 growth references provide consistent and coherent calculation results for the 3rd percentile of height and the 95th percentile of BMI for children and adolescents aged 3–18 years. Therefore, to ensure accurate patient classification and avoid potential clinical errors, the Polish 2010 and 2012 growth references should be exclusively adopted in all clinical settings for children aged 3 to 18 years.
References
Cole TJ. 1990. The LMS method for constructing normalized growth standards. Eur J Clin Nutr 44: 45–60.
de Onis M, Garza C, Onyango AW, Martorell R. 2006. WHO Child Growth Standards. Acta Paediatr 95, Suppl 450: 1–101.
Gelander L. 2006. Children’s growth: a health indicator and a diagnostic tool. Acta Paediatr 95(5): 517–18. https://doi.org/10.1111/j.1651-2227.2006.tb02276.x
González-Álvarez MA, Lázaro-Alquézar A, Simón-Fernández MB. 2020. Global trends in child obesity: are figures converging? Int J Environ Res Public Health 17(24): 9252. https://doi.org/10.3390/ijerph17249252
Jodkowska M, Woynarowska B, Oblacińska A. 2007. Test przesiewowy do wykrywania zaburzeń w rozwoju fizycznym u dzieci i młodzieży w wieku szkolnym. Warszawa: Instytut Matki i Dziecka.
Kułaga Z, Grajda A, Gurzkowska B, Góźdź M, Wojtyło M, Świąder A et al. 2013. Polish 2012 growth references for preschool children. Eur J Pediatr 172: 753–61. https://doi.org/10.1007/s00431-013-1954-2
Kułaga Z, Litwin M, Tkaczyk M, Palczewska I, Zajączkowska M, Zwolińska D et al. 2011. Polish 2010 growth references for school-aged children and adolescents. Eur J Pediatr 170: 599–609. https://doi.org/10.1007/s00431-010-1329-x
Mazur A, Wójcik M, Zachurzok A. 2024. Otyłość u dzieci i młodzieży. In: Socha P, Lebensztejn D, Kamińska D. Gastroenterologia dziecięca. Warszawa: Media-Press. 719–731.
Minister of Health, 2023. Ministry of Health decree from 24th of September 2013 on guaranteed benefits in the field of primary health care. J Laws Rep Poland; 1427. Warsaw: Minister of Health. Available at: https://isap.sejm.gov.pl/isap.nsf/DocDetails.xsp?id=WDU20230001427 [Accessed 1 August 2025].
Minister of Health, 2024. Announcement of the Minister of Health of 18 December 2024 on the list of reimbursed medicines, foodstuffs for particular nutritional uses and medical devices. Official J Min Health 137, Appendix B.19. Warsaw: Minister of Health. Available at: https://dziennikmz.mz.gov.pl/legalact/2024/137/ [Accessed 1 August 2025].
Palczewska I, Niedźwiedzka Z. 2001. Somatic development indices in children and youth of Warsaw. Dev Period Med 5 (2 Suppl 1): 18–118.
Reilly JJ, Wilson ML, Summerbell CD, Wilson DC. 2002. Obesity: diagnosis, prevention, and treatment; evidence-based answers to common questions. Arch Dis Child 86: 392–94. https://doi.org/10.1136/adc.86.6.392
WHO. 1995. Report of a WHO Expert Committee: Physical status: the use and interpretation of anthropometry. Geneva: World Health Organization.
Woynarowska B, Palczewska I, Oblacińska A. 2012. WHO child growth standards for children 0–5 years. Percentile charts of length/height, weight, body mass index and head circumference. Dev Period Med 16(3): 232–39.
Wright EM, Royston P. 1997. A comparison of statistical methods for age-related reference intervals. J R Statist Soc A 160(1): 47–69. https://doi.org/10.1111/1467-985X.00045
Final information
Acknowledgments
We thank the anonymous reviewer for valuable remarks and comments which improved the paper.
Author contributions
ZK designed the work, contributed to analysis, and interpretation of data, drafted the work. AK contributed to analysis, and interpretation of data and revised the manuscript critically for important intellectual content. All authors gave final approval of the version to be published.
Ethics statement
Not applicable.
Data availability statement
Data are available upon request from the corresponding author.
Financial disclosure
Not applicable.
Conflict of interest
The authors have no conflicts of interest to disclose.
Corresponding author
Aneta Kotowska, Public Health Department, The Children’s Memorial Health Institute, al. Dzieci Polskich 20, 04-730 Warsaw, Poland, e-mail: a.kotowska@ipczd.pl, Phone: +48 22 815 1378