Predicting Facial Anthropometry: A Novel Guide for Facial Reconstruction Using a Nigerian Igbo Sample
 https://orcid.org/0009-0007-0680-8843
Department of Human Anatomy, Faculty of Basic Medical Sciences, University of Delta, Agbor,
Nigeria
https://orcid.org/0000-0002-6306-279X
Department of Human Anatomy, Faculty of Basic Medical Sciences, Delta State University of
Science and Technology, Ozoro, Nigeria
https://orcid.org/0000-0003-3260-4848
Department of Anatomy, Faculty of Basic Medical Sciences, College of Health Sciences,
University of Port Harcourt, Choba, Nigeria
https://orcid.org/0009-0006-4396-5226
Department of Anatomy, Faculty of Basic Medical Sciences, College of Health Sciences,
University of Port Harcourt, Choba, Nigeria
Abstract. The present study was conducted to generate facial anthropometry baseline data for adult males and females of Igbo ethnicity in south-eastern Nigeria and to develop facial anthropometric prediction and correlation models. This cross-sectional, descriptive study design involved using 200 males and 200 females. The study criteria included subjects with no history of facial surgery and were within the age interval of 18–35 years. With the aid of spreading and digital caliper, different percutaneous facial measurements were obtained and data collected were analyzed both descriptively and inferentially. There were statistically significant sex differences in all metrics. Mandibular width (MW) correlated with both forehead width (FHW), lower facial height (LFH) and nasal width (NW) for both sexes. Total facial height (TFH) correlated with NW, upper facial height (UFH), mid-facial height (MFH), and lower facial height (LFH), while NW correlated with MW, UFH, MFH, and LFH. Predictive models developed using univariate regression analysis for both sexes showed that MW was a strong predictor of FHW, while UFH, MFH, and LFH were individually strong predictors of TFH (p<0.05). Further, MFH and LFH were significant predictors of FH for both sexes. By using multivariate regression analysis, it was revealed that the combination of both FW and FHW were strong predictors of MW, while the combination of UFH, MFH, and LFH were significant predictors of TFH. Conclusively, these new data should aid forensic and surgical efforts in Nigerian contexts. Our models can be tested on other underrepresented populations to better understand current methods in facial anthropometry.
Keywords: facial morphometry, predictive models, Igbo ethnicity, baseline data, Nigerian anthropometry
Introduction
The human face holds significant importance in biological anthropology due to its role in conveying essential information about an individual’s evolutionary history, health, behavior, and social interactions (Gračanin et al. 2018; Jones 2018). It exhibits considerable morphological diversity across populations due to genetic, environmental, and cultural influences (Darkwah et al., 2018). Facial anthropometry deals with the quantitative measurement and analysis of facial features and their proportions and how these features play significant roles in understanding and evaluating facial morphs in various ethnicities (Ulrich et al. 2019; Virdi et al. 2019; Rostovtseva et al. 2024). In developing countries such as Nigeria and parts of sub-Saharan Africa, facial anthropometrics provides a scientific basis for understanding facial variations considering how cultural perceptions of beauty and facial aesthetics do vary significantly in comparison to most European and Asian ancestries (Virdi et al. 2019; Monteiro et al. 2023; Sarna et al. 2023). These metrics also provide reliable information to craniofacial surgeons who practice in these countries to tailor reconstructive procedures to meet the specific facial aesthetic preferences of their populations. The use of standardized facial anthropometric measurements can help establish protocols for facial reconstruction surgeries, hence improving the consistency and predictability of surgical outcomes (Kundu et al. 2021).
From a biological anthropology perspective, the adherence of European-esque reconstructive skills on African individuals residing in major parts of sub-Saharan Africa presents a unique challenge, particularly when addressing facial surgeries since it has been established that facial morphs differ among ancestral groups globally. In accordance with several studies, African populations often exhibit distinctive facial characteristics such as broader forehead, wider mandible, and larger facial and nasal widths, as well as shorter upper and greater lower facial heights compared to most European and some Asian populations – which are highly attributed to genetic and environmental factors that collectively influence craniofacial development (e.g., Alam et al. 2015; Zacharopoulos et al. 2016; Virdi et al. 2019). With regards to sex differences across ancestral populations globally, males generally tend to have greater facial heights and widths, wider and larger nasal widths compared to females (Richmond et al. 2018; Kleisner et al. 2021). Based on an earlier report by Adekunle et al. (2021), which applied the use of 3-dimensional stereophotogrammetry to obtain facial metrics among selected Nigerian populations, Igbo males had the highest upper facial height, midfacial height, lower facial height, and total facial height measurements compared to their Yoruba and the Hausa counterparts.
While the use of 3-dimensional stereophotogrammetry is currently encouraged globally, its accuracy in most regions like Nigeria could often be affected by factors such as environmental conditions, as well as misrepresentation of facial bony architecture from obtained soft tissue data as conventional direct anthropometry often focuses more on bony landmarks and provide a more reliable assessment of skeletal dimensions. Along with other facial anthropometrics, a related study done among Nigerian adults selected from three major ethnic groups combined (Igbo, Yoruba and Hausa) revealed that men exhibited higher facial, forehead and nasal widths compared to women (Ernest et al. 2018). However, the study showed certain discrepancies in sample size when studied ethnicities were compared which could be influenced by selection bias as the Yorubas made up about 78% of the total studied population despite using a direct conventional anthropometry technique.
The aim of the present study was to provide baseline data of certain facial anthropometrics for adult males and females of south-eastern Nigeria and to develop prediction and correlation models using these metrics that would be relevant for sex-based reconstructive surgeries. The implications of this study will also flow to forensic identification efforts applied to the Nigerian Igbo population.
Material and Methods
Study Design
Ethical clearance was obtained from the Research Ethics Committee of the University of Port Harcourt (with registration number UPH/CEREMAD/REC/MM/91/005). All subjects gave their informed consent, and their personal information was kept confidential. A cross-sectional descriptive study design was used to obtain the facial metrics of n = 400 Indigenous people of the Igbo ethnic group of Nigeria between September 2024 to December 2024. The study population includes 200 males and 200 females of Indigenous Igbo with no/any history of facial surgery and are within the age interval of 18–35 years. This age interval accounted for soft and hard tissue changes in the face. The study subjects (of Igbo extraction) were recruited using the multi-stage random proportionate sampling technique and the minimum sample size was calculated using the Taro Yamane formula for quantitative studies as shown in previous studies (Asiwe et al. 2024; Fawehinmi et al. 2024).
Assessment of Facial Parameters
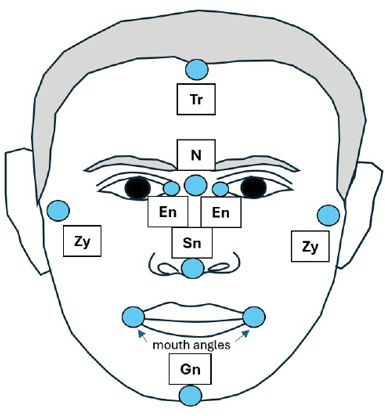
In line with Gupta et al. (2019), the following facial measurements were studied (based on the reference points as shown in Figure 1)
- Forehead width (FHW): FHW is defined as a horizontal distance that lies between the temporal ridges (tr) (the bony ridges above the outer edges of the eyebrows) with reference to the glabella (g).
- Mandibular width (MW): MW is a horizontal distance that is defined between the left and right gonion points (go) (the gonions are located at the outermost angles where the lower jaw curves upward) for consistency the mental protuberance is used for alignment purposes.
- Facial width (FW): FW is a horizontal facial metric measured between the left and right zygomatic bones (zy).
- Upper facial height (UFH): UFH is a vertical facial metric defined between the trichion (the sagittal midpoint of the forehead that borders the hairline) and nasion (the point in the middle line located at the nasal root).
- Mid-facial height (MFH): MFH is defined as a vertical distance between the nasion and the sub-nasale (sbn) (the point where the upper lip joins the columella).
- Lower facial height (LFH): LFH is defined as a vertical distance between the sub-nasal and the menton (the most inferior point of the inferior edge of the chin).
- Total facial height (TFH): TFH, also known as Physiological Facial height, is defined as a vertical facial metric between the trichion (tr) and the Menton (mt).
- Facial height (FH): FH is defined as the measurement between the nasion (n) and the menton (me).
- Nasal width (NW): NW is a horizontal facial metric defined as the distance between the alars (al) of the nose (the most lateral point of the alar contour of the nose).
Data Collection
A written consent form was administered to all respondents and only those who consented were allowed to participate in the research, they were issued a semi-structured questionnaire followed by face-to-face interviews to ensure the subjects met the inclusion criteria. Afterward, the age and sex were recorded, and using a direct anthropometric approach, the facial parameters were measured with the aid of spreading and digital calipers following the soft cutaneous landmarks of the face. Each measurement was conducted twice for reliability purposes.
Reliability of Data
The reliability of the instrument and result was examined using two statistical methods. Firstly, a paired t-test was used to compare the data collected, and secondly, we employed the use of the Cronbach alpha to evaluate the consistency of our results. The outcome presented that the reliability scale was 0.78, which indicates that our results were consistent.
Data Analysis
The data obtained in this study were subjected to statistical analysis using the International Business Machine of Statistical Package for Social Sciences (IBM SPSS version 25) and results are present descriptively in the form of means, standard errors of estimate (SEE), standard deviation, minimum and maximum values. Inferentially, t-tests, Pearson’s correlation tests, and regression model analysis were used to analyze the relationships between metrics across sexes. A probability of less than 0.05 was considered statistically significant.
Results
Descriptive Statistics, Differences and Correlation of Facial Metrics for Both Sexes
Table 1 shows the descriptive statistics of facial metrics for the male and female sample. The age findings present that the average for males was 22.11±4.30 years while females was 21.81±2.82 years. The average FHW was 10.43±0.91 cm in males while it was 9.64±0.95 cm for females. The mean MW for males was 10.88±0.73 cm while it was 10.20±0.72cm for females. The mean FW was 15.49±1.33 cm in males while for females, it was 14.51±2.03 cm. Mean UFH was 7.05±0.81 cm and 6.77±0.94 cm for males and females, respectively. Average MFH was 5.32±0.63 cm and 5.28±0.58 cm for males and females, correspondingly. Mean LFH in males was 8.89±0.81 cm while it was 8.45±0.94 cm in females. The mean TFH was 23.46±1.50 cm and 22.54±2.26 cm for males and females, respectively. In males, the mean FH was 14.21±1.10 cm, though in females, it was 13.70±1.24 cm, and the mean NW was 5.53±0.64 cm in males and 5.30±0.57 cm in females.
Table 2 shows the mean value of facial metrics based on sexes and the finding that there were observable statistically significant differences between the male and female in FHW, MW, FW, UFH, LFH, TFH, FH, and NW. This indicates that men had significantly higher mean values in all parameters except MFH (p>0.05).
| Parameter | Sex | Mean | SEM | SD | Min | Max |
|---|---|---|---|---|---|---|
| Age | Male | 22.11 | 0.35 | 4.30 | 18 | 35 |
| Female | 21.81 | 0.23 | 2.82 | 18.0 | 33.0 | |
| FHW | Male | 10.43 | 0.07 | 0.91 | 8.30 | 15.00 |
| Female | 9.64 | 0.08 | 0.95 | 7.30 | 11.32 | |
| MW | Male | 10.88 | 0.06 | 0.73 | 8.00 | 12.00 |
| Female | 10.20 | 0.06 | 0.72 | 7.40 | 12.00 | |
| FW | Male | 15.49 | 0.11 | 1.33 | 12.90 | 18.78 |
| Female | 14.51 | 0.17 | 2.03 | 10.38 | 18.68 | |
| UFH | Male | 7.05 | 0.07 | 0.81 | 4.86 | 9.06 |
| Female | 6.77 | 0.08 | 0.94 | 4.41 | 8.89 | |
| MFH | Male | 5.32 | 0.05 | 0.63 | 4.02 | 6.95 |
| Female | 5.28 | 0.05 | 0.58 | 3.54 | 6.94 | |
| LFH | Male | 8.89 | 0.07 | 0.81 | 7.19 | 11.28 |
| Female | 8.45 | 0.08 | 0.94 | 5.78 | 11.97 | |
| TFH | Male | 23.46 | 0.12 | 1.50 | 17.03 | 26.14 |
| Female | 22.54 | 0.19 | 2.26 | 13.79 | 25.86 | |
| FH | Male | 14.21 | 0.09 | 1.10 | 11.86 | 16.43 |
| Female | 13.70 | 0.10 | 1.24 | 10.92 | 16.76 | |
| NW | Male | 5.53 | 0.05 | 0.64 | 4.03 | 6.90 |
| Female | 5.30 | 0.05 | 0.57 | 3.67 | 6.78 |
FHW: forehead width, MW: mandibular width, FW: facial width, UFH: upper facial height, MFH: mid-facial height, LFH: lower facial height, TFH: total facial height, FH: facial height, NW: nasal width, SEM: standard error of mean, SD: standard deviation, Min: minimum, Max: maximum.
| Parameter | Male | Female | t-test | p | Statistical Inference |
|---|---|---|---|---|---|
| FHW | 10.43±0.91 | 9.64±0.94 | -6.73 | <0.0001 | Significant |
| MW | 10.88±0.72 | 10.20±0.71 | -8.040 | <0.0001 | Significant |
| FW | 15.49±1.32 | 14.51±2.02 | -4.857 | <0.0001 | Significant |
| UFH | 7.05±0.80 | 6.77±0.94 | -2.717 | 0.007 | Significant |
| MFH | 5.32±0.63 | 5.28±0.58 | -0.472 | 0.637 | Not Significant |
| LFH | 8.89±0.81 | 8.45±0.94 | -4.344 | <0.0001 | Significant |
| TFH | 23.46±1.50 | 22.54±2.26 | -4.170 | <0.0001 | Significant |
| FH | 14.21±1.10 | 13.70±1.23 | -3.771 | <0.0001 | Significant |
| NW | 5.53±0.64 | 5.30±0.57 | -3.232 | 0.001 | Significant |
FHW: forehead width, MW: mandibular width, FW: facial width, UFH: upper facial height, MFH: mid-facial height, LFH: lower facial height, TFH: total facial height, FH: facial height, NW: nasal width.
Table 3 shows the correlation of facial metrics for the males and the findings present that MW and FHW, FW and FHW, LFH and MW, TFH and MW, NW and MW, FW, UFH, MFH, LFH, TFH, FH, FW and MW, FW and MFH, LFH. UFH and FW were statistically significant while for the female category, MW and FHW, LFH and MW, NW and MW, FW and MFH, LFH, TFH, FH, UFH and TFH, MFH and TFH, FH, NW, LFH and TFH, FH, NW, TFH and FH, NW were statistically significant (Table 4).
| Parameter | FHW | MW | FW | UFH | MFH | LFH | TFH | FH | NW | |
|---|---|---|---|---|---|---|---|---|---|---|
| FHW | r | 1 | 0.231** | 0.089 | 0.155 | 0.121 | 0.162 | 0.075 | 0.224** | 0.055 |
| p | 0.006 | 0.304 | 0.067 | 0.147 | 0.051 | 0.373 | 0.007 | 0.516 | ||
| MW | r | 0.231** | 1 | 0.069 | 0.003 | 0.100 | 0.345** | 0.173* | 0.304** | 0.213* |
| p | 0.006 | 0.425 | 0.976 | 0.231 | <0.0001 | 0.037 | <0.0001 | 0.010 | ||
| FW | r | 0.089 | 0.069 | 1 | 0.318** | -0.105 | 0.148 | 0.228** | 0.059 | 0.524** |
| p | 0.304 | 0.425 | <0.0001 | 0.221 | 0.081 | 0.007 | 0.490 | <0.0001 | ||
| UFH | r | 0.155 | 0.003 | 0.318** | 1 | 0.083 | 0.029 | 0.430** | 0.060 | 0.226** |
| p | 0.067 | 0.976 | <0.0001 | 0.326 | 0.733 | <0.0001 | 0.475 | 0.007 | ||
| MFH | r | 0.121 | 0.100 | -0.105 | 0.083 | 1 | 0.345** | 0.203* | 0.727** | 0.242** |
| p | 0.147 | 0.231 | 0.221 | 0.326 | <0.0001 | 0.014 | <0.0001 | 0.003 | ||
| LFH | r | 0.162 | 0.345** | 0.148 | 0.029 | 0.345** | 1 | 0.370** | 0.810** | 0.480** |
| p | 0.051 | <0.0001 | 0.081 | 0.733 | <0.0001 | <0.0001 | <0.0001 | <0.0001 | ||
| TFH | r | 0.075 | 0.173* | 0.228** | 0.430** | 0.203* | 0.370** | 1 | 0.396** | 0.357** |
| p | 0.373 | 0.037 | 0.007 | <0.0001 | 0.014 | <0.0001 | <0.0001 | <0.0001 | ||
| FH | r | 0.224** | 0.304** | 0.059 | 0.060 | 0.727** | 0.810** | 0.396** | 1 | 0.406** |
| p | 0.007 | <0.0001 | 0.490 | 0.475 | <0.0001 | <0.0001 | <0.0001 | <0.0001 | ||
| NW | r | 0.055 | 0.213* | 0.524** | 0.226** | 0.242** | 0.480** | 0.357** | 0.406** | 1 |
| p | 0.516 | 0.010 | <0.0001 | 0.007 | 0.003 | <0.0001 | <0.0001 | <0.0001 | ||
FHW: forehead width, MW: mandibular width, FW: facial width, UFH: upper facial height, MFH: mid-facial height, LFH: lower facial height, TFH: total facial height, FH: facial height, NW: nasal width, *p<0.01, **p<0.05.
| Parameter | FHW | MW | FW | UFH | MFH | LFH | TFH | FH | NW | |
|---|---|---|---|---|---|---|---|---|---|---|
| FHW | r | 1 | 0.230** | -0.145 | 0.108 | -0.067 | 0.045 | 0.014 | -0.006 | 0.081 |
| p | 0.005 | 0.078 | 0.186 | 0.414 | 0.584 | 0.866 | 0.946 | 0.322 | ||
| MW | r | 0.230** | 1 | 0.025 | 0.155 | -0.051 | 0.180* | 0.127 | 0.103 | 0.186* |
| p | 0.005 | 0.768 | 0.062 | 0.542 | 0.029 | 0.126 | 0.216 | 0.025 | ||
| FW | r | -0.145 | 0.025 | 1 | 0.057 | 0.534** | 0.166* | 0.224** | 0.427** | -0.043 |
| p | 0.078 | 0.768 | 0.495 | <0.0001 | 0.044 | 0.006 | <0.0001 | 0.604 | ||
| UFH | r | 0.108 | 0.155 | 0.057 | 1 | 0.057 | -0.042 | 0.523** | 0.002 | 0.039 |
| p | 0.186 | 0.062 | 0.495 | 0.485 | 0.609 | <0.0001 | 0.985 | 0.634 | ||
| MFH | r | -0.067 | -0.051 | 0.534** | 0.057 | 1 | 0.156 | 0.393** | 0.689** | -0.192* |
| p | 0.414 | 0.542 | <0.0001 | 0.485 | 0.056 | <0.0001 | <0.0001 | 0.019 | ||
| LFH | r | 0.045 | 0.180* | 0.166* | -0.042 | 0.156 | 1 | 0.647** | 0.824** | 0.170* |
| p | 0.584 | 0.029 | 0.044 | 0.609 | 0.056 | <0.0001 | <0.0001 | 0.037 | ||
| TFH | r | 0.014 | 0.127 | 0.224** | 0.523** | 0.393** | 0.647** | 1 | 0.701** | 0.166* |
| p | 0.866 | 0.126 | 0.006 | <0.0001 | <0.0001 | <0.0001 | <0.0001 | 0.043 | ||
| FH | r | -0.006 | 0.103 | 0.427** | 0.002 | 0.689** | 0.824** | 0.701** | 1 | 0.015 |
| p | 0.946 | 0.216 | <0.0001 | 0.985 | <0.0001 | <0.0001 | <0.0001 | 0.855 | ||
| NW | r | 0.081 | 0.186* | -0.043 | 0.039 | -0.192* | 0.170* | 0.166* | 0.015 | 1 |
| p | 0.322 | 0.025 | 0.604 | 0.634 | 0.019 | 0.037 | 0.043 | 0.855 | ||
FHW: forehead width, MW: mandibular width, FW: facial width, UFH: upper facial height, MFH: mid-facial height, LFH: lower facial height, TFH: total facial height, FH: facial height, NW: nasal width, *p<0.01, **p<0.05.
Prediction of Facial Metrics for Female Sample Using Regression Models
Table 5 shows the summary of the univariate regression model of facial metrics for the female sample. The findings show that the correlation between FHW and FW was poor (r=0.08, r2=0.006, SEE=0.92, p<0.001):
FHW = 9.05+FW (0.04)
When predicted with MW, the correlation was still weak (r=0.23, r2=0.05, SEE=0.92, p<0.001):
FHW=6.51+MW (0.30)
The correlation between FW and FHW was poorly correlated (r=0.08, r2=0.006, SEE=2.04, p=0.30) and FW was predicted as:
FW = 12.62+FHW (0.19)
When predicted with MW, the correlation was poorly correlated (r=0.06, r2=0.004, SEE=2.04, p=0.42), FW was predicted as
FW = 12.51+MW (0.19)
When MW and FHW were also weakly correlated (r=0.23, r2=0.05, SEE=0.70, p=0.01), with the following prediction of MW:
MW = 8.50+FHW (0.17)
Using FW, there was no good correlation (r=0.06, r2=0.004, SEE=0.72, p=0.42) with the prediction of MW as:
MW = 9.83+FW (0.02)
When TFH was estimated using UFH, the correlation was moderate (r=0.43, r2=0.18, SEE=1.92, p<0.001) and the prediction was as follows:
TFH=16.13+UFH (0.96)
Using MFH, the correlation was weak (r=0.20, r2 =0.04, SEE= 2.22, p=0.01) and the estimation of TFH was:
TFH = 18.38+MFH (0.78)
Using LFH, the correlation was moderate (r=0.37, r2=0.14, SEE= 2.11, p<0.001) with the estimation as follows:
TFH = 15.02+LFH (0.88)
Estimating FH using MFH and LFH, the correlation of FH and MFH was strong (r=0.72, r2=0.52, SEE=0.84, p<0.001):
FH = 5.62+MFH (1.53)
Estimation of FH with LFH was also associated with a strong correlation (r=0.81, r2=0.66, SEE= 0.72, p<0.001):
FH = 4.73+LFH (1.06)
Table 6 shows the multivariate regression model of facial metrics for the female sample. The findings show that FHW could be estimated with FW and MW through a weak correlation (r=0.23, r2=0.05, SEE=0.89, p=0.28):
FHW = 6.39+MW (0.27) +FW (0.03)
Estimating FW with FHW and MW the correlation was also weak (r=0.10, r2=0.01, SEE=2.07, p=0.51):
FW = 11.33+MW (0.15) +
FHW (0.16)
When MW was estimated with FW and FHW, the correlation was still weak (r=0.22, r2=0.05, SEE=0.71, p=0.03):
MW = 8.25 – FW (0.02) +FHW (0.17)
The total facial height was estimated using the multivariate approach with UFH, MFH and LFH with a strong correlation (r=0.64, r2=0.41, SEE=1.64, p<0.001):
TFH = 5.91+UFH (0.92) +MFH (0.33) +LFH (1.04)
FHW: forehead width, MW: mandibular width, FW: facial width, UFH: upper facial height, MFH: mid-facial height, LFH: lower facial height, TFH: total facial height, FH: facial height, NW: nasal width, SEE: standard error of estimate.
| Parameters | r | R2 | SEE | p | Equations |
|---|---|---|---|---|---|
| FHW vs FW+MW | 0.23 | 0.05 | 0.89 | 0.28 | FHW = 6.39+MW (0.27) +FW (0.03) |
| FW vs FHW + MW | 0.10 | 0.01 | 2.07 | 0.51 | FW = 11.33+MW (0.15) +FHW (0.16) |
| MW vs FW +FHW | 0.22 | 0.05 | 0.71 | 0.03 | MW = 8.25 – FW (0.02) +FHW (0.17) |
| TFH vs UFH+MFH+LFH | 0.64 | 0.41 | 1.64 | <0.001 | TFH = 5.91+UFH (0.92) +MFH (0.33) +LFH (1.04) |
FHW: forehead width, MW: mandibular width, FW: facial width, UFH: upper facial height, MFH: mid-facial height, LFH: lower facial height, TFH: total facial height, FH: facial height, NW: nasal width, SEE: standard error of estimate.
Prediction of Facial Metrics for Male Sample Using Regression Models
Table 7 shows the summary of the univariate regression model of facial metrics for males. The findings present that FHW was estimated using FW through a weak correlation (r=0.14, r2=0.02, SEE=0.91, p=0.07):
FHW = 11.96 – FW (0.10)
When FHW was estimated with MW there was also a weak correlation (r=0.23, r2=0.05, SEE=0.90, p=0.005)
FHW = 7.23+MW (0.29)
When FW was estimated using FHW, the correlation was weak (r=0.14, r2=0.02, SEE=1.31, p=0.08):
FW = 17.67 – FHW (0.21)
Estimating FW with MW, there was no correlation (r=0.03, r2=0.001, SEE=1.31, p=0.76):
FW = 14.94+MW (0.045)
Further estimates of MW in males, using FHW and FW, gave a weak correlation (r=0.23, r2=0.53, SEE=0.70; p=0.005):
MW = 9.00+FHW (0.18)
Estimating MW using FW had no correlation (r=0.025, r2=0.001, SEE=0.73, p=0.76):
MW = 10.67+FW (0.014)
Estimating TFH using UFH, MFH and LFH had the following correlations: UFH and TFH= moderate, r=0.52, r2=0.27, SEE=1.21, p<0.001), TFH and MFH (moderate, r=0.39, r2=0.15, SEE=1.38 and p<0.001), and TFH and LFH (strong, r=0.64, r2=0.41, SEE=1.14, p<0.001):
TFH = 17.06+UFH (0.92)
TFH = 18.51+MFH (0.93)
TFH = 12.78+LFH (1.20)
Estimating FH using MFH and LFH found strong correlations for FW (r=0.68, r2=0.47, SEE=0.80, p<0.001) and LFH (r=0.82, r2=0.67, SEE=0.62, p<0.001):
FH = 7.836+MFH (1.19)
FH = 4.23+LFH (1.12)
FHW: forehead width, MW: mandibular width, FW: facial width, UFH: upper facial height, MFH: mid-facial height, LFH: lower facial height, TFH: total facial height, FH: facial height, NW: nasal width, SEE: standard error of estimate.
Table 8 shows the multivariate regression analysis of facial metrics for males. The findings present that FHW could be estimated using FW and MW through a strong correlation (r=2.88, r2=8.29, SEE=0.89, p=0.002):
FHW = 8.89+MW (0.31) – FW (0.12)
Estimating FW with FHW and MW had a weak correlation (r=0.17, r2=0.03, SEE=1.29, p=0.12).
FW = 16.70+MW (0.12) – FHW (0.24)
Estimating MW with FHW and FW had a weak correlation (r=0.24, r2=0.06, SEE=0.71, p<0.05)
MW = 8.32+FHW (0.19) +
FW (0.03)
Estimating TFH using UFH, MFH, and LFH had a strong correlation (r=0.94, r2=0.88, SEE=0.47, p<0.001).
TFH = 2.76+UFH (0.92) +MFH (0.82) +LFH (1.11)
FHW: forehead width, MW: mandibular width, FW: facial width, UFH: upper facial height, MFH: mid-facial height, LFH: lower facial height, TFH: total facial height, FH: facial height, NW: nasal width, SEE: standard error of estimate.
Discussion
Although applying 3D stereophotogrammetry can generate reproducible measurements, its precision is greatly dependent on accurate landmark placement in the software being used, and that can be challenging for African populations. Hence, the direct measurement approach was utilized for this current study. Based on the results, the present study found that there were notable significant sex differences in facial metrics apart from mid-facial height, as males generally had slightly higher facial metrics than females. In line with this study, Zacharopoulos et al. (2016) and Ernest et al. (2018) both reported significant sex differences in facial measurements as men exhibited greater dimensions in most parameters, in comparison to women. Findings from a similar study done using a Greek sample had reported that FH and MW were significantly larger in Greek males (Zacharopoulos et al. 2016). Zhuang et al. (2010) showed, from a European-based study conducted in North America, that both mean values of FW and TFH were smaller in females than males. In comparison with another study conducted among an Iranian sample, there were significant sex differences found in the studied facial parameters such as TFH, UFH, and FW (Dodangheh et al. 2018). It is explained that males generally tend to have greater facial heights and widths, wider and larger nasal widths compared to females across racial populations (Richmond et al. 2018; Kleisner et al. 2021).
Adekunle et al. (2021) showed, from a similar study conducted on a combined male sample from three major Nigerian ethnic groups (Yoruba, Igbo and Hausa), that the mean values for UFH, MFH, LFH, and TFH were 71.30 mm, 51.40 mm, 71.33 mm, and 194.04 mm, respectively. However, in comparison with our study, that focused on only Igbo subjects, the mean values that were somewhat close was only for UFH, as MFH, LFH, and TFH were higher than that of the findings of Adekunle et al. (2021). This inference seeks to deepen our understanding on the ethnic variations in facial metrics between the three major Nigerian ethnicities. The study carried out by Andrades et al. (2018), using a European sample, found that the mean MFH was 64.39 ± 3.55 mm – which is higher than that of the present study conducted using a Nigerian sample.
Furthermore, a Nepalese study showed that there were significant differences in FW and NW between males and females (Rokaya et al. 2018). Hamid et al. (2021) reported, from a Saudi population-based study, that significant differences in NW between males and females were observed. Another research showed, from their findings in a Ghanaian sample, that the mean FH, FW, and NW for males were 117.1 mm, 130.8 mm and 36.3 mm, which was slightly higher in females that had mean FH, FW, and NW of 110.4 mm and 127.2 mm. There were significant differences between males and females for FH, FW, and NW of the Ghanaian population (Appiah et al. 2023). In an Indian study that was reported by Pandey et al. (2015), the mean FW for males was 129.2 mm, while mean FW for females was 130.2 mm. Furthermore, the assertions from studies conducted in Nigerian, Ghanaian, Nepalese, Indian, and Saudi samples, underscore the need to consider ethnic and cultural variations in facial anatomy.
The findings in the current study, which mirror some of these results, can inform a more global perspective in plastic surgery and forensic efforts based on facial identification. For instance, when working with diverse patient populations, understanding the specific facial characteristics prevalent in those groups can guide surgeons in achieving results that align with the aesthetic standards and expectations of those communities (Brielmann & Pelli 2018). The significant differences in FW and NW between sexes noted in various studies suggest that postoperative assessments of surgical outcomes may also need to be stratified based on sex, and this could assist in tailoring outcome evaluations to reflect these sex differences towards better understanding patient satisfaction and the functional aspects of surgery, as evaluating success with a universal approach may not accurately reflect the diverse anatomical realities faced by different sexes. In line with Ernest et al. (2018), as it applies to its relevance in forensic facial reconstruction, their findings revealed that vertical facial measurements such as TFH, UFH and LFH, seemed to be more reliable facial parameters for distinguishing people of Igbo ethnicity from other Nigerian ethnicities such as Hausa and Yoruba, thus reflecting differences in craniofacial growth patterns associated with ethno-geographical attributes.
In this present study for both sexes, FHW correlated with MW, as well as MW correlating with LFH, and NW. Facial width showed a positive association with TFH, as well as TFH correlating strongly with parameters such as UFH, MFH, LFH, FH, and NW. Furthermore, both MFH and LFH were strongly associated with FH and NW, while NW correlated positively and strongly with MW, MFH, LFH, and TFH. Earlier research conducted by Iroanya et al. (2019) revealed that FH correlated with FW, and LFH significantly for both sexes – which is in line with our study.
We applied the use of both univariate and multivariate regression analyses to develop prediction models for determining facial metrics for each sex. We obtained a combination of models based on strong, moderate, and some weak correlations. With respect to the models that were developed using univariate regression analysis for both sexes, MW was a strong predictor of FHW, while UFH, MFH, and LFH were individually strong predictors of TFH (p<0.05). In addition, facial parameters such as MFH and LFH were individually significant predictors of FH for both sexes. However, the sex disparity was observed where FW was a strong predictor of FHW in females but not in males. Finally, the prediction models that were developed using multivariate regression analysis revealed similarities for both sexes whereby the combination of both FW and FHW were strong predictors of MW, while the combination of UFH, MFH, and LFH were considered to be significant predictors of TFH, although, the only disparity was observed in males where the combination of both FW and MW were strong predictors of FHW and not in females.
A limitation in this study was that orbital measurements were not considered to be suitable correlates with other facial measurements. We also obtained facial measurements from a young adult sample, aged between 18 – 35 years, meaning either younger or older age groups were not considered. Future investigations into similar analyses of facial anthropometric measurements should target all ages, or a wider age range.
Conclusion
The findings of this study revealed that apart from mid-facial height (MFH), all facial metrics showed significant differences across both sexes of the Igbo population. Prediction models for distinguishing between both sexes were more reliable when predicting facial parameters such as MW and TFH when using the variables such as FW, FHW, UFH, MFH, and LFH. These baseline results suggest that surgeons should adopt a personalized approach to reconstructive procedures, as well as recognizing these differences allows for tailored interventions that respect the unique anatomical features of each sex, thus enhancing aesthetic outcomes. Furthermore, this study has contributed to the creation of standardized data for forensic facial reconstruction that are specific to the Nigerian Igbo people.
References
Adekunle AA, Olowo AY, Adetona M, James O, Adamson OO, Agbogidi FO, Oladega A, Ogunlewe M, Adeyemo WL, Busch T, Mossey PA. 2021. Variations in facial anthropometric measurements among major ethnic groups in Nigeria: a 3-dimentional stereophotogrammetry analysis. Face 2(3): 236–43. https://doi.org/10.1177/27325016211029013
Alam MK, Mohd Noor NF, Basri R, Yew TF, Wen TH. 2015. Multiracial facial golden ratio and evaluation of facial appearance. PloS one 10(11): e0142914. https://doi.org/10.1371/journal.pone.0142914
Andrades, P., Cuevas, P., Hernández, R., Danilla, S., & Villalobos, R. (2018). Characterization of the orbital volume in normal population. J Cranio-Maxillo Sur 46(4), 594–599. https://doi.org/10.1016/j.jcms.2018.02.003
Appiah NK, Appiah AK, Tetteh J, Diby TK, Abaidoo CS. 2023. Anthropometric study of facial and nasal indices of the Akan ethnic population of Ghana. Sri Lanka J Forensic Med Sci Law 14(1). https://doi.org/10.4038/sljfmsl.v14i1.7924
Asiwe N, Adheke OM, Ezeah I, Okon M, Filima PL, Buseni OV. 2024. Discriminant and Multiple Linear Regression Analysis for Sex and Stature Estimation Using Upper Arm and Forearm-Hand Length: A Study among Mgbidi Population of Imo State Nigeria. AJMPCP 7(1): 295–305. https://doi.org/10.9734/ajmpcp/2025/v8i1272
Brielmann AA, Pelli DG. 2018. Aesthetics. Curr Biol 28(16): R859–63. https://doi.org/10.1016/j.cub.2018.06.004
Darkwah WK, Kadri A, Adormaa BB, Aidoo G. 2018. Cephalometric study of the relationship between facial morphology and ethnicity. Transl Res Anat 12: 20–4. https://doi.org/10.1016/j.tria.2018.07.001
Dodangheh M, Mokhtari T, Mojaverrostami S, Nemati M, Zarbakhsh S, Arabkheradmand A, Hassanzadeh G. 2018. Anthropometric study of the facial index in the population of medical students in Tehran University of Medical Sciences. GMJ Med 2(1): 51–7. https://doi.org/10.29088/gmjm.2018.51
Ernest MA, Sanu OO, Utomi IL, Ibeabuchi MN. 2018. Sexual dimorphism in facial soft tissue anthropometry among young adult Nigerians. J World Fed Orthod 7(3): 94–101. https://doi.org/10.1016/j.ejwf.2018.07.001
Fawehinmi HB, Oghenemavwe LE, Okoh PD, Ebieto CE, Irozulike FC, Asiwe N. 2024. Stature and Sex Estimation Using Some Linear Anthropometric Parameters: A Cross-Sectional Study of the Igbo Ethnic Group of Nigeria. AJMPCP 7(2): 482-489. https://doi.org/10.9734/ajmpcp/2025/v8i1266
Gračanin A, Bylsma LM, Vingerhoets AJ. 2018. Why only humans shed emotional tears: Evolutionary and cultural perspectives. Hum Nat 29: 104–33. https://doi.org/10.1007/s12110-018-9312-8
Gupta S, Narwal A, Kamboj M, Sharma P, Makkar V, Raman RK. 2019. Baseline data of facial parameters in the population of Haryana: An anthropometric study. J Forensic Dent Sci 11(1): 28–34. https://doi.org/10.4103/jfo.jfds_12_19
Hamid MM, Faragalla AI, Ibrahim WS, Eldin AB. 2021. Facial Anthropometry among Saudi Population. Ann Med Health Sci Res 11(4).
Iroanya OO, Oyeyemi MT, Egwuatu TF. 2019. Sexual dimorphism and anthropometric comparison of craniofacial features of Igbo and Yoruba Undergraduate Students of University of Lagos, Nigeria. Braz J Forensic Sci Med Law Bioeth 9(1): 8–91. https://doi.org/10.17063/bjfs9(1)y201968
Jones AL. 2018. The influence of shape and colour cue classes on facial health perception. Evol Hum Behav 39(1): 19–29. https://doi.org/10.1016/j.evolhumbehav.2017.09.005
Kleisner K, Tureček P, Roberts SC, Havlíček J, Valentova JV, Akoko RM, Leongómez JD, Apostol S, Varella MA, Saribay SA. 2021. How and why patterns of sexual dimorphism in human faces vary across the world. Sci Rep 11(1): 5978. https://doi.org/10.1038/s41598-021-85402-3
Kundu A, Streed M, Galzi PJ, Johnson A. 2021. A detailed review of forensic facial reconstruction techniques. Med Leg J 89(2): 106–16. https://doi.org/10.1177/0025817221989591
Monteiro LC, Ripardo RC, Torro-Alves N, Souza GS. 2023. Facial morphometric differences across face databases: influence of ethnicities and sex. Front Neurosci 17: 1130867. https://doi.org/10.3389/fnins.2023.1130867
Pandey N, Gogoi P, Budathoki D, Gopal KC. 2015. Anthropometric study of facial index of Medical students. JKMC 4(4): 131–4. https://doi.org/10.3126/jkmc.v4i4.18256
Richmond S, Howe LJ, Lewis S, Stergiakouli E, Zhurov A. 2018. Facial genetics: a brief overview. Front Genet 9: 462. https://doi.org/10.3389/fgene.2018.00462
Rokaya D, Suttagul K, Sapkota B, Maharjan SK. 2018. Gender based comparison of the relationships of maxillary anterior teeth and facial measurements. J Int Dent Med Res 11(2): 465–9.
Rostovtseva VV, Butovskaya ML, Mezentseva AA, Dashieva NB, Korotkova AA, Kavina A, Singh M. 2024. Cross-cultural differences in perception of facial trustworthiness based on geometric morphometric morphs. J Cross-Cult Psychol 55(2): 216–35. https://doi.org/10.1177/00220221231220013
Sarna K, Sonigra KJ, Ngeow WC. 2023. A cross-sectional study to determine and compare the craniofacial anthropometric norms in a selected Kenyan and Chinese population. Plast Surg 31(1): 84–90. https://doi.org/10.1177/22925503211024763
Ulrich L, Dugelay JL, Vezzetti E, Moos S, Marcolin F. 2019. Perspective morphometric criteria for facial beauty and proportion assessment. Appl Sci 10(1): 8. https://doi.org/10.3390/app10010008
Villanueva NL, Afrooz PN, Carboy JA, Rohrich RJ. 2019. Nasal analysis: considerations for ethnic variation. Plast Reconstr Surg 143(6): 1179e–88e. https://doi.org/10.1097/prs.0000000000005619
Virdi SS, Wertheim D, Naini FB. 2019. Normative anthropometry and proportions of the Kenyan-African face and comparative anthropometry in relation to African Americans and North American Whites. Maxillofac Plast Reconstr Surg 41:1–4. https://doi.org/10.1186/s40902-019-0191-7
Voegeli R, Schoop R, Prestat-Marquis E, Rawlings AV, Shackelford TK, Fink B. 2021. Cross-cultural perception of female facial appearance: A multi-ethnic and multi-centre study. Plos one 16(1): e0245998. https://doi.org/10.1371/journal.pone.0245998
Zacharopoulos GV, Manios A, Kau CH, Velagrakis G, Tzanakakis GN, de Bree E. 2016. Anthropometric analysis of the face. J Craniofac Surg 27(1): e71–5. https://doi.org/10.1097/scs.0000000000002231
Final information
Conflict of interest
Authors declared that there were no conflicts of interest.
Contributions from individual authors
NA was the lead researcher, conceived the concept of the study and design, performed the data collection, compilation and statistical analysis, provided some materials for the study and wrote the manuscript; OMA was the co-lead researcher, contributed to the concept of the study and design and did critical revision of the article for important intellectual content. Both MO and JSH provided some materials for the study and carried out some critical revision of the article. All authors discussed the results and contributed to the final manuscript for publication.
Ethics statement
Ethical clearance was obtained from the Research Ethics Committee of the University of Port Harcourt (with registration number UPH/CEREMAD/REC/MM/91/005). All subjects gave their informed consent, and their personal information was kept confidential.
Data availability statement
Due to ethical restrictions on sharing respondent data, the complete dataset cannot be made publicly available. Researchers can seek ethics approval and request access to anonymized data for re-analysis by contacting the corresponding author.
Financial disclosure
The authors declare that they have no known competing financial interests or personal relationships that could have appeared to influence the work reported in this manuscript.
Corresponding author
Oghenefego Michael Adheke, Department of Human Anatomy, Faculty of Basic Medical Sciences, Delta State University of Science and Technology, Ozoro, Delta State, Nigeria; Phone number: +234-8032261520, e-mail: mikeadheke@gmail.com, adhekeom@dsust.edu.ng