A Cross-Sectional Approach in Unveiling the Prevalence, Anthropometric Measurements, and Risk Factors of Eating Disorders among Bengalee Adolescent Females
Shaonee Saha
 https://orcid.org/0009-0006-9180-3475
Department of Food and Nutrition, West Bengal State University, Berunanpukuria, Barasat, West Bengal, India
Reetapa Biswas
https://orcid.org/0000-0002-7614-0945
Department of Food and Nutrition, West Bengal State University, Berunanpukuria, Barasat, West Bengal, India
Abstract. Background: The crucial adolescent period demands greater nutritional needs along with physical maturity where overweight can lead to sensitivity towards body image. Excessive appearance concern results in faulty eating habits and complementary behavioral approaches known as eating disorders (ED).
Aim: Due to inconsistencies in prior information regarding ED on Bengalee adolescent females, the cross-sectional study was conducted on Bengalee school females of rural and urban areas of North 24 Parganas district with the insights of prevalence, anthropometric parameters and risk factors of ED.
Method: The study design consisted of self-reported surveys using standardized questionnaires (Eating disorder examination questionnaire-28; Body shape questionnaire-34) to determine ED, body dissatisfaction (BD), meal skipping (MS) and objective assessments of anthropometric parameters of 396 students aged 13–19 years. Statistical analysis was conducted to interpret the findings.
Result: 14.39% ED and 44.95% BD cases were found in this community with significantly high BMI-for-age (BAZ), hip circumference and subscale values of ED questionnaire among ED participants. After chi-square and binary logistic regression analysis regular MS was found to be the strongest predictor of ED accounting for 14% likelihood of ED followed by fear-of-weight-gain (4.48%) and excessive exercise (3.88%).
Conclusion: The findings highlight a complex interplay of psychological and social factors contributing to ED. Regular MS emerged as the strongest predictor of ED, reflecting an unhealthy coping strategy driven by psychological stressors such as fear of weight gain, excessive exercise and BD. Influence of cultural norms on body image cannot be avoided. Our findings will help healthcare practitioners in designing identification treatment procedures and diet plans in a holistic way during further investigation of ED.
Key words: BMI-for-age, body dissatisfaction, eating disorder, meal skipping, overweight
Introduction
Adolescence is a period of key developmental changes including biological, psychological, social, and cognitive transformation. This period also involves emotional regulation and independency generation that impose the passion of self-regulatory manifestations (Silvers 2022). Brain restructuring and pubertal maturation make sensitive to social environment, psychological distress and long-term unhealthy dietary habits along with nutritional risks (Sisk and Gee 2022; Shawon et al. 2023). Additionally, sedentary lifestyle and rapid alteration in dietary behavior, resulting from globalization are increasing obesity prevalence among adolescents (Bauman 2023). Adiposity is determined during intrauterine phase, but after birth, favorable conditions further contribute to positive weight gain (Orsso et al. 2020). Childhood obesity may promote early pubertal maturation (Shalitin and Yablonski 2022), depression, anxiety, low self-esteem, body weight dissatisfaction (BWD) and irregular dietary habits (Tsekoura et al. 2021); whereas this early development among females can increase the concern on body image (Sicilia et al. 2024). Genetic and biological interplay during obesity contributes to weight stigmatization and behavioural risk patterns, emphasizing the likelihood of psychological complications and ED circumstances (House et al. 2022; Lister et al. 2023).
The multifaceted dimensions of Eating disorders (ED) are emerging as a global health concern (Prnjak et al. 2022; Yu and Muehleman 2023); characterized by faulty eating habits (restrictive or binging), mostly present with complementary behaviors like misuse of laxatives, self-vomiting and intense exercise (Val et al. 2022; Aranda et al. 2023). Body dissatisfaction (BD), the negative self-perception towards current and desired physical appearance stands as a central and crucial accelerator for the onset and maintenance of ED, resulting in a number of detrimental outcomes. American Psychiatric Association 2013 included body image in diagnostic criteria of ED by DSM-V but comprehensive investigation is still lacking (Lantz et al. 2018; Prnjak et al. 2022; Feng et al. 2023). Eating disorders are becoming increasingly common in Western Asia (Alfalahi et al. 2021), especially among females with high body mass index (BMI), disguising the primary symptoms, due to the established norms of beauty concept, putting their life into danger (Gil et al. 2023). Recent prevalences among adolescents include 8.9% in China (Li et al. 2022), 38.3% in India (Ganguly et al. 2018), 9.62% in Taiwan (Chen et al. 2023). This indicates inconsistency in current research among Indian adolescents, making the detection of ED in a community sample as an urgent and challenging task, as skilled supervision is needed to ensure accurate diagnosis.
Presently, community investigations for ED and BD use standardized questionnaires relying on recall by the individual to answer the questions. As per DSM-IV criteria, the behavioral symptoms should be present for at least twice in a week in the last 3 months to be categorized as ED (Almutairi et al. 2023). Thus, community-based investigations are needed to understand the changing behavioral patterns and prevent malnutrition earlier.
The present study was conducted on adolescent females of North 24 Parganas district of West Bengal, addressing inconsistencies in cross-sectional information and aiming to focus the lack of progress in research in India to cover some objectives, including determining the prevalence of ED and BD in rural and urban area, comparing anthropometric parameters between ED and control group, and exploring the association of ED with various parameters and the possible risk factors of ED.
Materials and methods
A cross-sectional study was conducted in North 24 Parganas district West Bengal from May 2022 to January 2023 using zone-wise distribution of schools, in sub-divisions. It aimed at quantitative estimation of nutritional parameters among diverse students of similar age and mentality. Divergence and concentration of heterogenous group of students in schools make it an ideal place of data collection. The district concurrently includes urban and rural areas with the highest density of population per square km area. It is eventually impacted by the customs and culture of Kolkata which surrounds it to the west (Brief industrial profile 2023).
The study was initiated by obtaining ethical clearance from Institutional Ethics Committee (IEC) for Research on Human Subjects (approval no. WBSU/IEC/30/05) in accordance with the ‘Ethical Guidelines for Biomedical Research on Human Subjects’ of Indian Council of Medical Research (ICMR) revised version of 2006. In view of deficit in prior information about adolescent population size or prevalence rate of ED in the district, sample size was determined from the following Cochran (1975) formula (Singh and Masuku 2014)

[n0= sample size, Z is the area under the acceptance region in a normal distribution curve which is 1.96 at 95% confidence interval, p= estimated proportion of an attribute in a population, q = (1-p) e = level of precision ±5%]
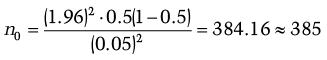
A 10% margin was added to the sample size computation to account for anticipated non-responses resulting in a target sample size of 424 people. From list of schools, 96 females and coeducational schools were randomly selected from rural and urban areas of the district. 52 schools granted permission and were recruited for the study.
In the next step, researchers explained the importance and procedure of the study to class IX–XII students and their guardians with inclusion criteria such as age (13–19 years), females, unmarried, cultural trend (Bengalee), physiological condition (apparently healthy and free from any other diseases), place of residence (residing at respective rural or urban setting since birth); collected informed consent declaring their purposeful interest and used a random selection lottery method to gather nine students from each school from the list of willing participants using a mix of self-reported surveys and objective assessments.
Eating disorder was detected using ‘Eating Disorder Examination Questionnaire-6.0’ as per Fairburn et al. 2014, a validated tool consisting of 28 questions divided into four subscales (restraint, eating, weight, and shape scale) with global score >=4 is recommending ‘ED’ (Carter et al. 2001) and rests are ‘control’. BD was measured using ‘Body Dissatisfaction Questionnaire-34’ (BSQ-34) comprising of 34 questions on 6 point Likert scale. Higher score indicates higher body image concern and the value >80 is considered to have BD (Laporta-Herrero et al. 2016). The informed consent and questions were translated into Bengalee and further tested for clarity and authenticity and described thoroughly to the participants before the survey interview.
A pilot study was conducted on a 10% sample of the total estimated sample size in the same area to ensure validity and reliability of the questionnaires. Cronbach’s alpha values were 0.94 and 0.98 respectively for EDE-Q and BSQ-34 that allowed usage of these tools for this survey.
Then the study proceeded with anthropometric assessments. Standing height and weight were measured with stadiometer and digital weighing machine with bare foot, minimum clothing at flat surface and 2 hours after eating (Das 2016). Age-wise BMI-z-score (BAZ) was calculated using WHO ‘Anthro Plus’ Software which uses the WHO 2007 Growth reference (Bhargava et al. 2020) and classified accordingly. The BAZ curve obtained from the software was included in result portion. The linear diameter of waist and hip were measured using non stretching measuring tape to determine waist-hip ratio (WHR) by apportioning the waist by hip circumference. Waist circumference (WC) was taken between the lowest part of rib cage and upper part of iliac crest. The widest part of hip bone was rounded to note hip circumference (HC) (Bacopoulou et al. 2015). WHR is a crucial measure of fat movement and potential health risks. Waist-to-height ratio (WHtR) was also calculated. Skinfold thickness at three sites (thigh, suprailiac and triceps) were measured by Harpenden skinfold calipers to obtain body density by Jackson-Pollock formula (Jackson et al. 1980) and used for BFP calculation by Siri equation (Mohammadi and Shakerian 2010). To avoid error value, all the anthropometric measurements were taken thrice and the mean value was taken.
To observe meal skipping (MS) tendency, each individual was asked regarding their consumption of food and drink in a day with help of 24 hours recall questionnaire. This process was continued for 7 days (Locks et al. 2022; Meshram et al. 2024). It was further confirmed by separately asking about it in terms of ‘never’, ‘sometimes’, and ‘regular’. Participants were asked about how many of them skipped any of three major meals in a day in past week. If someone skipped at regular basis or atleast 6 days then termed as ‘regular meal skipper’. If the skipping frequency was less than 6–7 days then ‘sometimes meal skipper’ and others were taken as ‘never’ to skip meals (Zahrah et al. 2023). Weight management practice was investigated with emphasis on exercise in any form. Type of exercise done to control weight gain was recorded as ‘moderate’ and ‘excessive’, and they were compared with individual having ‘no’ exercise habit (CDC guideline). Fear-of-weight-gain (FWG) response was collected from EDE-Q.
After gathering all relevant data, some responses were eliminated, such as students from other cultural background, previously diagnosed with any issues like PCOS, diabetes, thyroid, anemia, anxiety, depression, missing/ incomplete data, non-cooperative, living in mess/ hostel, changed their residence any time before the study etc. to maintain data homogeneity. The ultimate sample structure was formed with 396 adolescent females and proceeded for statistical analysis.
Data were entered into Microsoft excel and then transferred to IBM Statistical Packages for Social Sciences (SPSS version 24) for coding and statistical analysis. Categorical variables such as place of residence, MS, fear of weight gain, exercise pattern was coded. BAZ, WHR, WHtR were made into categorical variables and coded accordingly for chi-square analysis. Graph and heatmap correlation matrix were created at excel. Tables were made into Microsoft word using table option as per result obtained from SPSS output. BAZ curves were obtained from WHO Anthro plus software. Group differences of anthropometric parameters and subscale scores were obtained by performing independent-t test. Chi-square and binary logistic regression functions were run to evaluate the association and contribution of each factor on development of ED. In logistic regression odds ratio (OR) was calculated to estimate risk factors. The relationship between ED and BD in control of anthropometric variables was evaluated by semi-partial correlation analysis. All statistical analysis was done at p<0.05.
Results
Table 1 shows prevalence of ED and BD according to place. Figure 1 shows a comparison of ED prevalence rates of adolescents in different Indian studies. A total of 14.39% ED (56.14%, 43.80% from rural and urban area respectively) and 44.95% BD (51.68%, 43.81% from rural and urban area respectively) were found. Prevalence of other studies shown in Figure 1 were taken from Upadhyay and Mishra (2014), Babu and Aroor (2017), Ganguly et al. (2018), Nivedita et al. (2018), and Dikshit et al. (2020).
| Place of residence | Total (n %) | ||
|---|---|---|---|
| Rural (n %) | Urban (n %) | ||
| Eating disorder status | |||
| Present | 32 (56.14%) | 25 (43.80%) | 57 (14.39%) |
| Absent | 179 (52.80%) | 160 (47.19%) | 339 (85.61%) |
| Body perception | |||
| Dissatisfied | 92 (51.68%) | 86 (48.31%) | 178 (44.95%) |
| Satisfied | 119 (54.59%) | 99 (45.41%) | 218 (50.05%) |
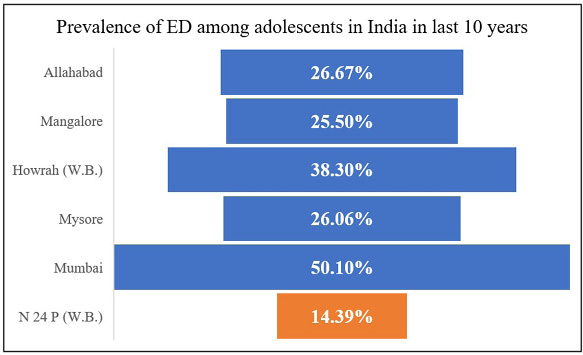
Table 2 shows number and percentage of participants in accordance to BAZ. Among total population, 65.15% (ED= 42.10% Control= 69.03%) were in normal category, followed by 21.21% overweight, 8.83% obesity, 2.77% thinness, and 1.26% severe thinness. ED category showed higher cases of overweight and obesity. This community represented very few incidences of undernutrition as overall 2.27% thinness was present both in ED and control group and only 1.26% severe thinness appeared in control group. Despite restrictive eating behavior and weight control approaches, BAZ score of ED participants did not go <-3 SD, affirms inconsistency of ED with undernutrition, but does not ensure optimum health status of them. The comparison of BAZ categories of the study population with compared to WHO reference curve is shown in Figure 2.
Figure 2a shows the right side shifting of z-score curve from WHO standard BMI curve. Figure 2b shows scatterness of the curve in both overweight and underweight categories. The average BAZ value was still very lower than reference curve suggesting presence of malnutrition in overall population. It is visible that overweight or obesity cases are more than undernutrition.
| BAZ status | ED {n (%)} | Control {n (%)} | Total {n (%)} |
|---|---|---|---|
| Severe thinness (<-3SD) | 0 (0%) | 5 (1.47%) | 5 (1.26%) |
| Thinness (<-2SD) | 1 (1.75%) | 10 (2.95%) | 11 (2.77%) |
| Normal (-2SD to 1SD) | 24 (42.10%) | 234 (69.03%) | 258 (65.15%) |
| Overweight (>1SD) | 23 (40.35%) | 61 (17.99%) | 84 (21.21%) |
| Obesity (>2SD) | 9 (15.79%) | 29 (8.55%) | 35 (8.83%) |
| Total | 57 | 339 | 396 |
† BAZ= BAZ= BMI-for-age-z score SD= standard deviation
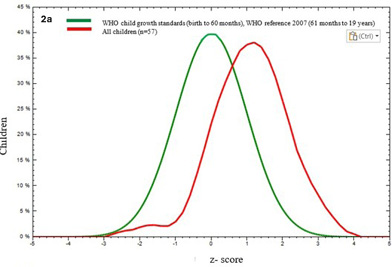
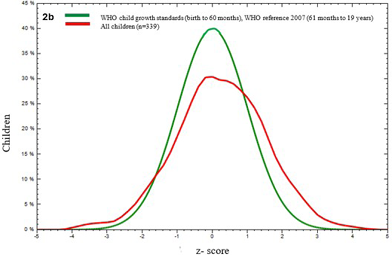
Table 3 shows significantly higher value (p<0.05) of BAZ, HC, and EDE-Q subscale scores among ED subjects. Normal BAZ category contributed to the most significant difference, indicating general tendency of overweight of ED participants. For subscale variation, the highest concern was observed in ‘shape concern’ scale, followed by ‘weight concern’, ‘eating’ and ‘restraint concern’.
| Parameters | ED (n= 57) | Control (n= 339) | p value | |
|---|---|---|---|---|
| Mean (± SD) | ||||
| Anthropometric parameters | ||||
| BAZ | Total | 1.09 ± 1.01 | 0.21 ± 1.30 | <0.01** |
| Normal | 0.29 ± 0.5 | -0.18 ± 0.76 | <0.01** | |
| Overweight | 1.47± 0.28 | 1.40 ± 0.27 | 0.31 | |
| Obesity | 2.57±0.38 | 2.57±0.57 | 0.99 | |
| BFP | 27.29 ± 3.93 | 26.58 ± 4.49 | NS | |
| WC | 74.80 ± 12.07 | 72.50 ± 11.20 | NS | |
| HC | 92.17 ± 11.18 | 88.72 ± 11.98 | 0.043* | |
| WHR | 0.80 ± 0.06 | 0.81 ± 0.05 | NS | |
| Subscale scores | ||||
| Restraint Scale | 2.99 ± 1.16 | 0.07 ± 1.05 | <0.01** | |
| Eating concern | 3.16 ± 1.21 | 0.56 ± 0.77 | ||
| Weight concern | 4.59 ± 1.31 | 1.25 ± 1.22 | ||
| Shape concern | 5.06 ± 0.78 | 1.53 ± 1.34 | ||
† Note= As there was no severe thinness and only one thinness subject in ED group so group difference can’t be performed in this case. **p<0.01, *p<0.05, NS= not significant
BAZ= BMI-for-age-z score, BFP= body fat percentage, WC= waist circumference, HC= hip circumference, WHR= waist-hip ratio, SD= standard deviation
Further, the association of different variables with ED was determined by chi-square test for independence at 5% level of significance (p<0.05), that reflected a statistically strong significant association between ED and some parameters except place of residence, age, waist-hip ratio (WHR), and waist-to-height ratio (WHtR). Tables 4,5,6 respectively represented chi-square association of socio-demographic, anthropometric and lifestyle variables with ED.
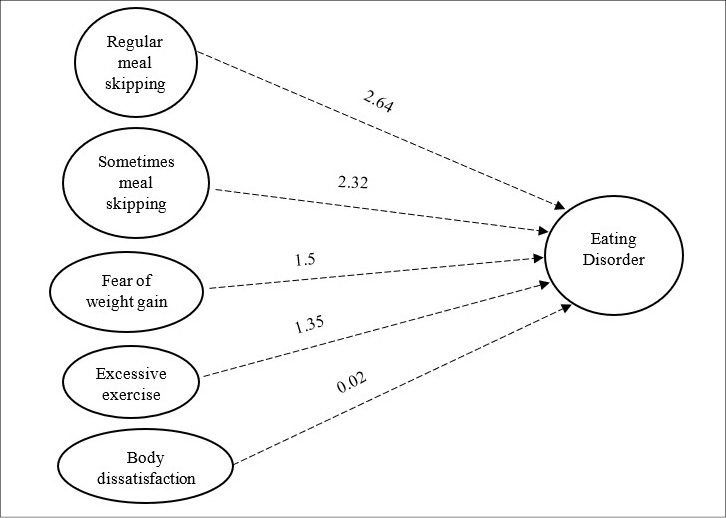
Significant variables of table 4,5,6 were entered into logistic regression model as predictor variables to observe their likelihood on ED. Chi-square assumption (p=0.922) in Hosmer-Lemeshow goodness of fit data indicates the fitness of model at acceptable level where the variance of predictor variables ranges between 27%- 48% based on Cox and Nagelkerke R2 [Table 7] and model fitness at 90.4% [Table 8]. Regression analysis shows significant positive association of BD, MS, FWG and excessive exercise with ED. High BAZ did not appear as a significant risk factor of ED [Table 9]. Chi square analysis significant variables may mislead for direct linear relationship and regression analysis confirms their relationship when other variables are present. Contribution of each significant variable on occurrence of ED is presented in Figure 3.
| Parameters | ED | χ2 (Sig. value) | |
|---|---|---|---|
| Present | Absent | ||
| Place of residence | |||
| Rural | 32 | 179 | 0.218 (NS) |
| Urban | 25 | 160 | |
| Age (years) | |||
| 13 | 3 | 11 | 1.17 (NS) |
| 14–16 | 21 | 146 | |
| 17–19 | 33 | 182 | |
[NS= non-significant]
| Parameters | ED | χ2 (Sig. value) | |
|---|---|---|---|
| Present | Absent | ||
| BAZ | |||
| ST | 0 | 5 | 20.405 (<0.01)** |
| Thinness | 1 | 10 | |
| Normal | 24 | 234 | |
| Overweight | 22 | 61 | |
| Obesity | 10 | 29 | |
| WHR | |||
| Gynoid (<0.8) | 24 | 132 | 0.205 (NS) |
| Android (>0.8) | 33 | 207 | |
| WHtR | |||
| <0.5 | 32 | 216 | 1.197 (NS) |
| >=0.5 | 25 | 123 | |
[BAZ= BMI z score, ST▪= Severe thinness, WHR= waist-hip ratio, WHtR= Waist-to-height ratio. ** significant p<0.01; *significant p<0.05; NS= not significant]
| Parameters | ED | χ2 (Sig. value) | |
|---|---|---|---|
| Present | Absent | ||
| BD | |||
| Present | 48 | 130 | 41.47 (<0.01)** |
| Absent | 9 | 209 | |
| Fear of weight gain (FWG) | |||
| Yes | 42 | 103 | 39.42 (<0.01)** |
| No | 15 | 236 | |
| Exercise pattern | |||
| No | 33 | 241 | 10.97 (0.004) ** |
| Moderate | 16 | 85 | |
| Excessive | 8 | 13 | |
| Meal skipping (MS) | |||
| Regular | 23 | 22 | 82.86 (<0.01)** |
| Sometimes | 11 | 13 | |
| Never | 23 | 304 | |
[BD= Body dissatisfaction, ** significant p<0.01]
| Model summery | H-L test | |||||
|---|---|---|---|---|---|---|
| Step | -2 Log Likelihood | Cox and Snell R square | Nagelkerke R square | Chi-square value | df | p value |
| 1 | 200.48 | 0.272 | 0.485 | 3.19 | 8 | 0.922 |
| Observed | Predicted | |||
|---|---|---|---|---|
| ED | Percentage Correct | |||
| Absent | Present | |||
| Step 1 | ED | |||
| Absent | 329 | 10 | 97.1 | |
| Present | 28 | 29 | 50.9 | |
| Overall Percentage | 90.4 | |||
Among all the significant variables, ‘regular’ MS increased the occurrence of ED by 14 times (OR=14.03; 95% CI= 5.82–33.82), followed by ‘sometimes’ MS to about 10 times (OR=10.18; 95% CI= 3.31–31.30), with compared to reference category (no MS).
Next, significant factor was ‘fear of weight gain’. FWG accounted for four times increment in odds of ED (OR=4.48; 95% CI=2.09–9.62). The result for exercise pattern indicated when excessive exercise was done, then the likelihood of ED went around 3.8 times (OR=3.88; 95% CI=1.03–1.04); while for moderate exercise, the odds increased at 1.9 times (OR=1.92; 95% CI=0.85–4.36) than its respective reference category (no).
One unit increase in BD score can increase the probability of ED only one time (OR=1.02; 95% CI= 1.01–1.04) and thus, BD has very less contribution in developing ED than other variables included in the model. Actually, MS and FWG develop primarily which are contributing factors of BD and BD arises at later stage.
Various studies established BD and high BMI as significant risk factors of ED but the concern about physique is very specific to cultural norms and lifestyle approaches and this cross-sectional study tried to seek the strength of BD and BAZ on development of ED among Bengali adolescent females. Here, BD was responsible only one time and BAZ only 1.3 times odds on occurrence of ED.
| Predicted variables | Regression coefficient (B) | Standard Error (SE) | Chi-square (Wald) value | p value | Odds ratio | 95% CI | |
|---|---|---|---|---|---|---|---|
| lower | upper | ||||||
| BD | 0.027 | 0.007 | 15.25 | <0.01** | 1.027 | 1.01 | 1.04 |
| BAZ | 0.278 | 0.164 | 2.877 | 0.09 | 1.32 | 0.95 | 1.80 |
| Meal skipping | – | – | 41.89 | <0.01** | – | – | – |
| Regular (ref: never) | 2.641 | 0.449 | 36.610 | <0.01** | 14.03 | 5.82 | 33.82 |
| Sometimes (ref: never) | 2.32 | 0.573 | 16.38 | <0.01** | 10.18 | 3.31 | 31.30 |
| FWG Yes (ref: never) | 1.50 | 0.389 | 14.91 | <0.01** | 4.48 | 2.09 | 9.62 |
| Exercise | – | – | 5.48 | 0.06 | – | – | – |
| Moderate (ref: no) | 0.656 | 0.417 | 2.46 | 0.11 | 1.92 | 0.85 | 4.36 |
| Excessive (ref: no) | 1.35 | 0.677 | 4.02 | 0.04* | 3.88 | 1.03 | 1.04 |
| Constant | -6.02 | 0.73 | 66.94 | <0.01** | 0.002 | – | – |
† Notes: There was no missing data. Odds ratio were determined for predicted variables BD, BAZ, Meal skipping (MS), FWG and Exercise. Dichotomous dependent variable ED was expressed as present and absent. MS, FWG, exercise was converted into categorical variable. Categories of MS: ‘regular’– daily at least one major meal in a day for last 7 days; ‘sometimes’– at least 3–4 days for last 7 days; ‘never’– skip no meal in last 7 days; FWG: yes and no; Exercise: tendency to do at moderate excessive never in a week. The individual value of BD and BAZ of each participant were included for analysis in continuous scale. The significance level is denoted by **= p<0.01 *= p<0.05.
BD= body dissatisfaction, BAZ= BMI-for-age z score, FWG= fear of weight gain
Regression equation:
Logit (P)= -6.02 + 0.02* BD + 0.27* BAZ + 2.64* MS (regular) + 2.32* MS (sometimes) + 1.5* FWG (yes) + 0.65* Exercise (moderate) + 1.35* Exercise (excessive)
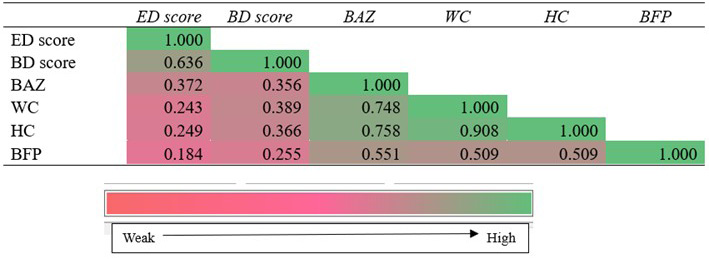
Among all the anthropometric variables, BAZ had the highest correlation with ED (r=0.37 though the strength of correlation is low). When all other variables were removed except BAZ, then the correlation of BD reduced to 0.53 from 0.63 (model 2). In model 3, the non-significant variables, i.e., HC and BFP were excluded and then the correlation was slightly increased at 0.56 (still at moderate degree of correlation) due to inclusion of WC. Increase in R2 values and gradual decrease of standardized coefficient beta value from model 1–3 suggest proper exclusion of the particular variables from the model. It indicates that heavy body weight or high BAZ and WC are the main anthropometric factors to initiate BD and in turn ED. The correlation matrix is shown by a heatmap visual chart (Figure 4) where the color intensity has increased from pink to green according to correlation coefficient. Controlling anthropometric parameters on BD and ED in Analysis by Semi-partial correlation can be seen in Tables 10–12.
| BD Score | WC | HC | BFP | BAZ | ||
|---|---|---|---|---|---|---|
| Pearson Correlation | ED Score | 0.636 | 0.243 | 0.249 | 0.184 | 0.372 |
| Sig. (1-tailed) | ED Score | <0.01** | <0.01** | <0.01** | <0.01** | <0.01** |
† BD= body dissatisfaction WC= waist circumference HC= hip circumference BFP= body fat percentage BAZ= BMI-for-age z score. **p<0.01
| Model | Standardized Coefficients Beta | Sig. | |||
|---|---|---|---|---|---|
| Zero-order | Part | ||||
| 1 | BD Score | 0.636 | <0.01** | 0.636 | 0.636 |
| 2 | BD Score | 0.577 | <0.01** | 0.636 | 0.539 |
| BAZ | 0.167 | <0.01** | 0.372 | 0.156 | |
| 3 | BD Score | 0.612 | <0.01** | 0.636 | 0.561 |
| BAZ | 0.342 | <0.01** | 0.372 | 0.226 | |
| WC | -0.251 | <0.01** | 0.243 | -0.163 | |
| Model | Standardized Coefficients Beta | Sig. | Zero-order | |
|---|---|---|---|---|
| 1 | (Constant) | no data | 0.001 | no data |
| BD Score | 0.614 | <0.01** | 0.636 | |
| BAZ | 0.367 | <0.01** | 0.372 | |
| WC | -0.211 | 0.023* | 0.243 | |
| HC | -0.038 | 0.681 | 0.249 | |
| BFP | -0.048 | 0.293 | 0.184 | |
**p<0.01 *p<0.05
Discussion
The prevalence rates of BD and ED of our study are not limited by geographical location as seen in Table 1. The study found the least prevalence of ED among adolescents in India till now. It is far consistent with 13.6% of Thangaruju et al. (Thangaraju et al. 2020) where same questionnaire was applied on undergraduate students. This variation could be the influence of social media’s potency to instill a western philosophy among rural teen minds. Most importantly these prevalence rates can act as documentation for cross-sectional motive of addressing ED behavior among adolescent school females. Body dissatisfaction prevalence of our study came within global prevalence of 19.2–83.8% in various community-based studies (Martini et al. 2022) or 40–60% among adolescent females where 30–60% females preferred to follow inappropriate weight control behaviors (Flament et al. 2015). Further presence of overweight/obesity increased the severity of ED due to weight stigmatization and overestimation (Matthews et al. 2022), predominantly lead to restrictive eating. Therefore, prior weight status poses immense role on severity and progression of ED and metabolic functions of the body (Jhe et al. 2023). Overweight is identified as unacceptable weight status that sometimes raises external pressure of weight loss, thin-body internalization and weight-teasing attitudes (Lin et al. 2023), drive individuals towards improper lifestyle behaviors as seen in ED. It supports the higher chances of overweight and obesity among them [Table 2 and Figure 2a,b]. Consistent presence of ED symptoms such as psychometric properties of body concern, eating and other lifestyle behaviors are confirmed by higher subscale values which distinguish the people having ED from others. Significant difference suggests the presence of symptoms did not appear by chance, but rather developed from indigenous practices in their real lives.
Therefore, cross-sectional studies in different countries even across regions of a single country show variation in prevalence rates due to broad spectrum of cultural differences, social norms, misunderstanding of beauty standards, genetic adaptation, family practices of individual, and questionnaire used. Though the prevalences of BD and ED of this study are not so alarming but still needs to be considered seriously to take timely preventive approach.
Meal skipping and fear-of-weight-gain tendency for intensive exercise, high BAZ, and BD values have been found as significant predictive risk factors of ED. Obesity is not only the sole risk factor of ED, as various studies have reported the development of ED during or after obesity treatment, indicating a complex metabolic interplay between obesity and psychometric allowance for ED behaviors (McMaster et al. 2023). All these factors are inter-related, such as FWG often triggers pervasive feelings of dissatisfaction, leading to emotional disturbance and cognitive regulation on food intake, reinforcing the ED characteristics. Also, persistent ED promotes all these factors in reciprocal way, further increasing the obsession and compulsive behaviors (Nearman et al. 2024). Meal skipping can contribute to emotional eating and unhealthy dietary choices, resulting in binging, poor lifestyle practices, and a surge in obesity (Zahrah et al. 2023). In this study, MS has been found as the most common approach, accounting for almost 10-14 times rise in occurrence of ED. Therefore, only the psychological freight is not alarming, if it thrives any unscientific practice in regular lifestyle then only it can emerge the severity of ED.
The study suggests that tendency of excessive exercise contributed to about three times increase in risk of ED. Regular physical exercise definitely improves overall quality of life but addiction may trigger for rigid workout schedule for achieving perfect figure. Though the study did not analyze dietary pattern except MS, the findings on exercise pattern and ED was consistent with previous research, that found significant and positive correlation between the healthy dietary pattern with the exercise addiction and shape concern. Apart from dietary pattern, exercise addiction among adolescents can accelerate the risk of ED by promoting psychological distress, sleep disturbances and body image concern particularly among females. Pubertal development of adolescence augments the physiological disillusions or BD and vigorous exercise schedule that take over the charge of dominating lifestyle behaviors for ensuring figure correction; but actually, imposing adverse health effects. A study also mentioned the strongest mediation effect of body image on exercise intensity and ED. So, body image holds the central part of exercise behavior and BD (Ahorsu et al. 2023; Khosro et al. 2024). BD also formed significant positive correlation with ED in presence of BAZ, the most confounding factor, while other anthropometric parameters were in control. A study in Saudi Arab found moderate level of association between ED and BD when the effect of BMI was controlled. BMI can increase due to various causes and not always related to westernization but eventually leading the threat of ED in presence of dissatisfaction and excessive concern on body image (Melisse et al. 2022).
Due to cross-sectional design the study possesses some limitations. Firstly, the eating behaviors, body concern and meal skipping tendency were estimated from the responses given by the participants. So, it was not possible to capture the recall bias, if any, that may underreport these behaviors. The study did not include socioeconomic status and social factors that may influence the above behaviors. Additionally, the changes in anthropometric measurements over time can’t be covered at a single point of time that lacks the information about the unhealthy lifestyle choices whether it appear concurrently with or prior to the onset of ED. The cause-relation effect of the variables was also not established. Lastly, the study focused on a specific adolescent population of a district which limited the generalizability of the findings to other adolescents of the state.
Conclusion
This cross-sectional approach was undertaken to shed light on eating-related attitudes of both rural and urban adolescent females of the district. The findings highlight the growing sensitivity towards body image during adolescence, where regular MS has emerged as the strongest predictor of ED, reflecting an unhealthy coping strategy driven by psychological stressors such as FWG, excessive exercise, and BD and socio-cultural norms. Though ED is a widely researched topic, this study recognized a complex interplay of psychological and social factors in the response of ED among Bengalee adolescent females along with their anthropometric indices where limited literature exists in this context. It will undoubtedly help medical practitioners, nutritionists, and policymakers in understanding the health implications and designing the treatment procedure and diet plans. In comparison with other studies, variation exists in prevalence rates due to differences in the survey tool used, participants’ type, family and social background, cultural trends, daily habits, etc. High BAZ values among ED participants may be a cause or consequence of ED, and it needs a longitudinal study design to determine the fact. Poor BAZ in participants without ED detection does not mean its absence, but suggests frequent investigations and health care monitoring along with the promotion of mental awareness. However, in regard to ED, the study focuses on the attitudes, anthropometric status, risk factors of ED, and lifestyle choices of young teenagers in West Bengal’s North 24 Parganas district, which becomes helpful information for further investigation. At last, the study has found gaps in understanding the effects of social media use, family, friends, and cultural norms on body image; the psychological spectrum and food habits on ED; and any cause-effect pathway of the variables in the Bengalee community.
References
Ahorsu DK, Imani V, Potenza MN, Chen HP, Lin CY, Pakpour AH. 2023. Mediating roles of psychological distress insomnia and body image concerns in the association between exercise addiction and eating disorders. Psychol Res Behav Manag 31:2533–42. https://doi.org/10.2147/PRBM.S414543
Alfalahi M, Mahadevan S, Balushi RA, Chan MF, Saadon MA, Al-Adawi S, Qoronfleh MW. 2022. Prevalence of eating disorders and disordered eating in Western Asia: a systematic review and meta-Analysis. Eat Disord 3;30(5):556–85. https://doi.org/10.1080/10640266.2021.1969495
Almutairi R, Azuhairi AA, Mahmud A, Dablool AS. 2023. Eating disorders among adolescent female students in Jeddah Saudi Arabia. Malays J Med Sci 30(1):185. https://doi.org/10.21315/mjms2023.30.1.16
Babu SS and Aroor AR. 2017. Eating disorder among Indian adolescent. Ind J Youth Adol Health 4(1):11–15. https://doi.org/10.24321/2349.2880.201703
Bacopoulou F, Efthymiou V, Landis G, Rentoumis A, Chrousos GP. 2015. Waist circumference waist-to-hip ratio and waist-to-height ratio reference percentiles for abdominal obesity among Greek adolescents. BMC Pediatrics 15(1). https://doi.org/10.1186/s12887-015-0366-z
Bauman D. 2023. Impact of obesity on female puberty and pubertal disorders. Best Pract Res Clin Obstet Gynaecol 10:102400. https://doi.org/10.1016/j.bpobgyn.2023.102400
Bhargava M, Bhargava A, Ghate SD, Rao RSP. 2020. Nutritional status of Indian adolescents (15–19 years) from National Family Health Surveys 3 and 4: Revised estimates using WHO 2007 Growth reference. PLOS ONE 15(9):e0239923. https://doi.org/10.1371/journal.pone.0239923
Brief Industrial profile of North 24 Pargana district Ministry of MSME Govt. of India. https://dcmsme.gov.in/old/dips/NORTH%2024-PARGANAS.pdf. Accessed 2.5.2023.
Carter JC, Stewart DA, and Fairburn C. 2001. Eating disorder examination questionnaire: norms for young adolescent girls. Behav Res Ther 39:625–632. https://doi.org/10.1016/s0005-7967(00)00033-4
CDC Physical activity basics. https://www.cdc.gov/physical-activity-basics/measuring/index.html. Accessed Jan 2023.
Chen DR, Lin LY, Levin B. 2023. Differential pathways to disordered eating for immigrant and native adolescents in Taiwan. J Eat Disord 11(1):54. https://doi.org/10.1186/s40337-023-00781-4
Das S. 2016. Textbook of community nutrition. 2nd edition. Academic Publishers. ISBN: 978-93-83420-69-8.
Dikshit R, Karia S, Shah N, Sonavane S, and DeSousa A. 2020. A study on binge eating behavior in urban adolescents. Asian J Psychiatr. 50:101998. https://doi.org/10.1016/j.ajp.2020.101998
Feng B, Harms J, Chen E, Gao P, Xu P, and He Y. 2023. Current Discoveries and Future Implications of Eating Disorders. Int J Environ Res Public Health 20(14):6325. https://doi.org/10.3390/ijerph20146325
Fernández-Aranda F, Granero R, and Jiménez-Murcia S. 2023. Eating Disorders and Addictive Behaviors: Implications for Human Health. Nutrients 15(17):3718. https://doi.org/10.3390/nu15173718
Flament MF, Henderson K, Buchholz A, Obeid N, Nguyen HN, Birmingham M, Goldfield G. 2015. Weight status and DSM-5 diagnoses of eating disorders in adolescents from the community. J Am Acad Child Adolesc Psychiatry 54(5):403–11. https://doi.org/10.1016/j.jaac.2015.01.020
Ganguly N, Roy S, Mukhopadhyay S. 2018. Association of socio-culture factors with disordered eating behavior: An empirical study on urban young girls of West Bengal India. Anthropol Rev 81(4):364–378. https://doi.org/10.2478/anre-2018-0032
House ET, Lister NB, Seidler AL, Li H, Ong WY, McMaster CM, Paxton SJ, Jebeile H. 2022. Identifying eating disorders in adolescents and adults with overweight or obesity: A systematic review of screening questionnaires. Int J Eat Disord 55(9):1171–93. https://doi.org/10.1002/eat.23769
Jackson AS, Pollock ML, Ward A. 1980. Generalized equations for predicting body density of women. Med Sci Sports Exerc 12:175–81.
Jhe GB, Lin J, Freizinger M, Richmond T. 2023. Adolescents with anorexia nervosa or atypical anorexia nervosa with premorbid overweight/obesity: What should we do about their weight loss?. J Child Adolesc Psychiatr Nurs 36(1):55–8. https://doi.org/10.1111/jcap.12394
Khoshro S and Abbasalizad Farhangi M. 2024. Major dietary patterns exercise addiction and eating disorders among a sample of physically active young adults. Nutr Metab Insights 17 11786388241258938. https://doi.org/10.1177/117863882412589
Lantz E, Gaspar M, DiTore R, Piers A and Schaumberg K. 2018. Conceptualizing body dissatisfaction in eating disorders within a self-discrepancy framework: a review of evidence. Eat Weight Disord 23:275–291. https://doi.org/10.1007/s40519-018-0483-4
Laporta-Herrero I, Jáuregui-Lobera I, Barajas-Iglesias B, Santed-Germán MÁ. 2016. Body dissatisfaction in adolescents with eating disorders. Eat Weight Disord 3(3):339–347. https://doi.org/10.1007/s40519-016-0353-x
Li S, Song L, Twayigira M, Fan T, Luo X, Shen Y. 2022. Eating disorders among middle school students in a Chinese population: Prevalence and associated clinical correlates. J Psych Res 154:278–85. https://doi.org/10.1016/j.jpsychires.2022.07.062
Lin JA, Jhe G, Adhikari R, Vitagliano JA, Rose KL, Freizinger M, Richmond TK. 2023. Triggers for eating disorder onset in youth with anorexia nervosa across the weight spectrum. Eat Disord 31(6):553–72. https://doi.org/10.1080/10640266.2023.2201988
Lister NB, Baur LA, Felix JF, Hill AJ, Marcus C, Reinehr T, Summerbell C, Wabitsch M. 2023. Child and adolescent obesity. Nat Rev Disease Prim 18;9(1):24. https://doi.org/10.1038/s41572-023-00435-4
Locks LM, Shah M, Bhaise S, Hibberd PL. Patel A. 2022. Assessing the diets of young children and adolescents in India: challenges and opportunities. Front Pediatr 17(10):725812. https://doi.org/10.3389/fped.2022.725812
Lopez-Gil JF, Garcia-Hermoso A, Smith L, Firth J, Trott M, Mesas AE, Jimenez-Lopez E, Gutierrez-Espinoza H, Tarraga-Lopez PJ, Victoria-Montesinos D. 2023. Global proportion of disordered eating in children and adolescents: A systematic review and meta-analysis. JAMA Pediatr 177(4):363–72. https://doi.org/10.1001/jamapediatrics.2022.5848
Martini MCS, Assumpção D, Barros MBA, Mattei J, Barros Filho AA. 2022. Prevalence of body weight dissatisfaction among adolescents: a systematic review. Rev Paul Pediatr. 41:e2021204. https://doi.org/10.1590/1984-0462/2023/41/2021204
Matthews A, Kramer RA, and Mitan L. 2022. Eating disorder severity and psychological morbidity in adolescents with anorexia nervosa or atypical anorexia nervosa and premorbid overweight/obesity. Eat Weight Disord 27:233–242. https://doi.org/10.1007/s40519-021-01168-7
McMaster CM, Paxton SJ, Maguire S, Hill AJ, Braet C, Seidler AL, Nicholls D, Garnett SP, Ahern AL, Wilfley DE, Lister NB. 2023. The need for future research into the assessment and monitoring of eating disorder risk in the context of obesity treatment. Int J Eat Disord 56(5):914–24. https://doi.org/10.1002/eat.23898
Melisse B, Blankers M, de Beurs E, van Furth EF. 2022. Correlates of eating disorder pathology in Saudi Arabia: BMI and body dissatisfaction. J Eat Disord 24;10(1):126. https://doi.org/10.1186/s40337-022-00652-4
Meshram II, Nagalla B, Kodavanti MR, Avula L, Veera BG. Overweight/obesity pre-diabetes diabetes and its association with hypertension and other factors among rural adults (≥ 18 years) in India. Ind Heart J 2024 May 1;76(3):182–91. https://doi.org/10.1016/j.ihj.2024.06.010
Mohammadi EF and Shakerian SA. 2010. Comparison of body composition assessment in women using skinfold thickness equations bioelectrical impedance analysis and underwater weighing. SPCT 17(3):223–230.
Nivedita N, Sreenivasa G, Rao TS, Malini SS. 2018. Eating disorders: Prevalence in the student population of Mysore South India. Ind J Psych 60(4):433–7. https://doi.org/10.4103/psychiatry.IndianJPsychiatry_97_16
Orsso CE, Colin-Ramirez E, Field CJ, Madsen KL, Prado CM, Haqq AM. 2020. Adipose tissue development and expansion from the womb to adolescence: an overview. Nutr 8;12(9):2735. https://doi.org/10.3390/nu12092735
Prnjak K, Jukic I, Mitchison D, Griffiths S and Hay P. 2022. Body image as a multidimensional concept: A systematic review of body image facets in eating disorders and muscle dysmorphia. Bod Im 42:347–360. https://doi.org/10.1016/j.bodyim.2022.07.006
Ralph-Nearman C, Hooper MA, Hunt RA, Levinson CA. 2024. Dynamic relationships among feeling fat fear of weight gain and eating disorder symptoms in an eating disorder sample. Appet 1;195:107181. https://doi.org/10.1016/j.appet.2023.107181
Shalitin S, Gat-Yablonski G. 2022. Associations of obesity with linear growth and puberty. Horm Res Paediatr 95(2):120–36. https://doi.org/10.1159/000516171
Shawon MS, Jahan E, Rouf RR, Hossain FB. 2023. Psychological distress and unhealthy dietary behaviours among adolescents aged 12–15 years in nine South-East Asian countries: a secondary analysis of the Global School-Based Health Survey data. Brit J Nutr 129(7):1242–51. https://doi.org/10.1017/S0007114522002306
Sicilia Á, Griffiths MD, Martín-Albo J. 2024. A Longitudinal Study of Pubertal Timing and Tempo on Body Shame Among Young Adolescent Girls and Boys. Sex Roles 90(12):1923–36. https://doi.org/10.1007/s11199-024-01537-3
Silvers JA. 2022. Adolescence as a pivotal period for emotion regulation development. Curr Op Psych 1 (44):258–63. https://doi.org/10.1016/j.copsyc.2021.09.023
Singh AS, Masuku MB. 2014. Sampling techniques and determination of sample size in applied statistics research: An overview. Intl J Econom Comm Manag 2(11):1–22.
Sisk LM, Gee DG. 2022. Stress and adolescence: Vulnerability and opportunity during a sensitive window of development. Curr Op Psych 1(44):286–92. https://doi.org/10.1016/j.copsyc.2021.10.005
Thangaraju SI, Karpagalakshmi R, Arumuganathan S, Usaid S, Devi SS, Sethumadhavan V. 2020. A cross-sectional study on prevalence of eating disorder and body image disturbance among female undergraduate medical students. J Mental Health Hum Behav 25:53–6. https://doi.org/10.4103/jmhhb.jmhhb_13_20
Tsekoura E, Kostopoulou E, Fouzas S, Souris E, Gkentzi D, Jelastopulu E, Varvarigou A. 2021. The association between obesity and the risk for development of eating disorders-A large-scale epidemiological study. Europ Rev Med Pharmacol Sci 25(19). https://doi.org/10.26355/eurrev_202110_26883
Upadhyay A and Mishra R. 2014. Prevalence and risk factors for eating disorder in Indian adolescent females. Nat J Physiol Pharm Pharmacol 4(2):153–157. https://doi.org/10.5455/njppp.2014.4.041220131
Val A, Cano M, Ruiz J, Canals J and Martín R. 2022. Characterization epidemiology and trends of eating disorders. Nutr hospital 39:8–15. https://doi.org/10.20960/nh.04173
Yu Z and Muehleman V. 2023. Eating Disorders and Metabolic Diseases. Int J Environ Res Pub Health 20. https://doi.org/10.3390/ijerph20032446
Zahrah NI, Fanani M, Ardyanto TD. 2023. The relationship between emotional eating meal skipping and unhealthy food consumption pattern in adolescent girls. Indonesian J Pub Health 18(1):47–58. https://doi.org/10.20473/ijph.v18i1.2023.47-58
Final information
Ethical approval
Data were collected after getting ethical clearance from West Bengal State University Institutional Ethics Committee (IEC) for Research on Human Subjects (approval no. WBSU/IEC/30/05) in accordance with ‘Ethical Guidelines for Biomedical Research on Human Subjects’ of Indian Council of Medical Research (ICMR) revised version of 2006.
Consent to participate
Written consent was obtained for participation in the entire survey process from the guardians of the participants prior to data collection.
Consent for publication
Not applicable as no individual’s data or image will be used in publication. All the information will be kept confidential. The paper has not been previously published nor under consideration of any journal and it is approved by all authors and the institutions where it was.
Acknowledgements
We highly acknowledge all the participants and school principals for their support and cooperation in completing the study.
Funding
The authors were granted no funding for the research.
Conflict of interests
The authors declare that they have no conflict of interest.
Authors’ contribution
Author SS was involved in data collection. SS and RB both contributed to the study designing data analysis and drafting the manuscript. Both authors read the manuscript and declared that it is their original research work and approved for submission and publication.
Corresponding author
Dr. Reetapa Biswas, Department of Food and Nutrition; West Bengal State University; Berunanpukuria, Barasat, North 24 Parganas, West Bengal, Pin-700126, India. Phone no.: +918820536039, E-mail: biswasreetapa@gmail.com