 https://orcid.org/0000-0001-9781-8121
Introduction
The issue of the nutritional status of children and adolescents in various regions of the world is widely discussed. Data shows that the average BMI value and the prevalence of obesity have increased worldwide (NCD Risk Factor Collaboration 2017). Although the trend of increasing excessive body weight in children and adolescents has stopped in highly developed countries (Wabitsch et al. 2017), it continues in developing countries (Rivera et al. 2014). As a result, a double threat to the health of children and adolescents can be observed. On the one hand, the number of people with excessive body weight is increasing, and, on the other hand, the problem of malnutrition in adolescents is becoming more visible. Analyses conducted by Garrido-Miguel et al. (2021) show that in Europe the prevalence of underweight is significant and amounts to approximately 8–9% of population, with an upward trend. The coexistence of malnutrition and overnutrition is a serious problem in most countries and is also noticeable in the eastern regions of Poland. The research by Saczuk (2018) conducted in the years 1986–2016 shows that the highest incidence of both deficiency and excess body weight is observed in youngest children.
The last fifteen years in Poland have been a period of rapid changes and social transformations due to the accession to the European Union. At that time, a deepening disproportion in the economic status of Polish society has been observed, and differences in the nutritional status of children and adolescents has become more apparent. This problem is observed both in areas of the country with higher economic indicators (Nowak-Szczepanska et.al 2021), as well as in regions exhibiting a slower pace of development (Wasiluk and Saczuk 2015). During the last five years the Family 500+ program in the field of social policy has been implemented, which was designed to help families raise children by providing monthly childcare benefits in the amount of PLN 500 for each child in the family. Moreover, changes in lifestyle related to the covid-19 pandemic has also been observed. It is, therefore, of great importance to determine the rate at which changes in the nutritional status occur in children living in different environments, including those living in economically underdeveloped areas of the country. The aim of this study is to determine changes observed during the last fifteen years in body height, BMI, and the incidence of underweight, normal weight-to-height proportions, and overweight among girls and boys living in towns and villages in eastern Polish voivodships.
Material and methods
In the years 2005–2006, as part of the statutory research of the Academy of Physical Education in Warsaw (D.S 45), research was carried out on children and adolescents aged 7–19. This included a continuation of the observations conducted in 1985–1986 and 1995–1996 (Saczuk 2011). During the first part of the study (1985–1986), 70 schools were randomly selected from the list of educational institutions obtained from the Education Superintendents, in accordance with the settlement structure of these areas, aimed to maintain an equal number in all voivodships. All students in each school were measured. In 2006, other educational institutions were randomized to the schools evaluated twenty years earlier, aiming to maintain comparable numbers of rural and urban residents. The study covered 3691 students, including 1703 girls and 1988 boys aged 7–9, living in eastern voivodeships of the country (Podlaskie, Lubelskie, and Podkarpackie).
Observations covering the same schools were repeated in 2015–2016 as a part of the statutory research of the Academy of Physical Education in Warsaw (D.S 203). Data of 2,149 students was collected, including 1,024 girls and 1,125 boys aged 7–9. Research staff of the AWF Branch in Biała Podlaska, as well as school teachers and students of the Department of Health Promotion, were assisting in conducting the study.
This study, with the consent of the Rector of the University of Physical Education in Warsaw, also includes data obtained from a research conducted in 2021 as a part of the nationwide program “Active return to school – PE with AWF”, of which the authors of this study were co-executors. The results of 4321 schoolgirls and 4573 schoolchildren were used in the study, which constituted 8894 respondents from the following voivodships: Podlaskie, Lubelskie, and Podkarpackie. In the “Active return to school – physical education from the University of Physical Education” program, the data were collected by properly trained physical education teachers.
Detailed information regarding the number of examined girls and boys in subsequent observation dates, including age and the population size of the place of residence, is presented in Table 1.
| year of study | town | village | ||||
| 2006 | 2016 | 2021 | 2006 | 2016 | 2021 | |
| age (years) | boys | |||||
| 7 | 214 | 132 | 637 | 213 | 222 | 651 |
| 8 | 358 | 153 | 801 | 483 | 304 | 728 |
| 9 | 286 | 129 | 879 | 434 | 185 | 877 |
| total | 858 | 414 | 2317 | 1130 | 711 | 2256 |
| age (years) | girls | |||||
| 7 | 251 | 116 | 586 | 265 | 203 | 682 |
| 8 | 313 | 143 | 752 | 274 | 205 | 690 |
| 9 | 272 | 136 | 816 | 328 | 221 | 795 |
| total | 836 | 395 | 2154 | 867 | 629 | 2167 |
Source: own study.
The research was conducted in accordance with the principles contained in the Declaration of Helsinki and was approved by the Senate Ethics Committee operating at the University of Physical Education in Warsaw. Questionnaire-derived information regarding the date of birth and the environmental conditions in which the respondents were brought up was collected. Anthropometric measurements were carried out in accordance with approved anthropometric techniques (IBP 1969). Body mass index (BMI), i.e., weight in kilograms divided by height squared of the study participants was also measured. Gender, arithmetic means, and dissemination measures for body height and BMI were also calculated within the calendar age groups. Such statistics were made using studies from 2006, 2016, and 2021. Subsequently, differences in the size of the mentioned development indicators were calculated between the dates of the research. Significant differences between the groups were verified by the ANOVA analysis of variance and the Newmann-Keuls test.
From the research material, study participants exhibiting underweight, overweight, and normal BMI values were selected, basing on the selection method developed by Cola et al. (2007, 2010). The obtained results allowed to calculate the percentages of girls and boys with I○, II○, and III○ underweight, normal BMI, overweight and obese. Such calculations were made at subsequent observation dates, taking into account places of residence (town, village). Subsequently, differences in BMI percentage between 2016 and 2006 and 2021 and 2016 were calculated. This allowed to determine the size and direction of changes in BMI. Statistical differences between the number of people classified into each of the above-described groups was determined using the χ2 test.
Results
From 2006 to 2016, body height of girls from towns in eastern Poland increased by an average of 1.76 cm (Figure 1, Table 2). The greatest changes were observed in nine-year-olds (2.88 cm), and the smallest in eight-year-olds (2.88 cm). In the analysed decade, greater differences in body height were observed in rural girls. The average difference, when all age groups were considered, was 2.33 cm. The greatest changes in body height were observed in eight-year-olds (3.96 cm), and the smallest in nine-year-olds (0.64 cm) although not all changes were statistically significant.
In the years 2016–2021, the body height of young women living in towns of eastern Poland increased by 0.88 cm. The greatest differences were found in eight-year-olds (1.78 cm), followed by nine-year-olds (1.20 cm). However, among the youngest girls, the difference was -0.33 cm. Among girls from the village in the analysed period, greater differences in height were found. The average difference in body height between 2021 and 2016 was 1.71 cm. The largest changes were noted in nine-year-olds (3.39 cm) and seven-year-olds (1.78 cm). In 2016 and 2021, the results of eight-year-olds were at a similar level, the difference was -0.05 cm.
In boys, a large, statistically significant increase in body height was also observed between 2006 and 2016. In urban dwellers, height increased by 3.73 cm, and in rural areas by 2.01 cm. In urban residents, the greatest differences were noted in seven-year-olds (5.27 cm), followed by nine-year-olds (3.54 cm) and eight-year-olds (2.37 cm). Among the villagers, the greatest changes were observed at the age of 7 years (3.21 cm), followed by 8 years (2.10 cm) and nine years (0.73 cm).
Lower values of the secular trends of the body height of boys were recorded in the years 2016–2021. In 2021, urban residents had a slightly lower height (-0.42 cm) compared to the results from 2016. A significant deceleration was observed in seven-year-olds (-2.15 cm) while a slight deceleration in nine-year-olds (-0.13 cm). In eight-year-olds, the difference was 1.03 cm. In the same period of time, body height among boys from rural areas increased on average by 1.65 cm, and statistically significant differences were found in nine-year-olds (3.04 cm) and eight-year-olds (1.34 cm).
| age (years) | year of study | Anova | Newmann-Keuls test | ||||||||
| 2006 | 2016 | 2021 | 2006–2016 | 2006–2021 | 2016–2021 | ||||||
| x– | SD | x– | SD | x– | SD | ||||||
| girls town | |||||||||||
| 7 | 124.81 | 6.10 | 127.14 | 7.10 | 126.81 | 6.95 | 8.67 | 4.34* | 5.55* | 0.68 | |
| 8 | 130.26 | 6.84 | 130.34 | 6.16 | 132.12 | 6.45 | 11.23 | 0.17 | 6.00* | 4.23* | |
| 9 | 134.36 | 7.27 | 137.24 | 2.25 | 138.44 | 6.80 | 39.44 | 5.90* | 12.55* | 2.79* | |
| girls village | |||||||||||
| 7 | 122.81 | 5.35 | 125.21 | 6.55 | 126.99 | 6.70 | 40.73 | 5.65* | 12.63* | 4.92* | |
| 8 | 127.87 | 6.77 | 131.83 | 6.73 | 131.78 | 6.40 | 29.94 | 8.67* | 10.62* | 0.14 | |
| 9 | 134.04 | 7.35 | 134.68 | 8.03 | 138.07 | 6.56 | 40.9 | 1.37 | 10.82* | 9.02* | |
| boys town | |||||||||||
| 7 | 125.31 | 6.01 | 130.58 | 6.87 | 128.43 | 6.23 | 34.47 | 10.74* | 9.76* | 4.36* | |
| 8 | 130.25 | 5.97 | 132.62 | 6.6 | 133.65 | 6.35 | 36.31 | 5.53* | 12.05* | 2.63 | |
| 9 | 135.66 | 7.74 | 139.2 | 7.96 | 139.07 | 6.54 | 24.81 | 6.67* | 9.77* | 0.28 | |
| boys village | |||||||||||
| 7 | 124.23 | 6.39 | 127.44 | 6.32 | 128.00 | 6.29 | 30.76 | 7.65* | 11.02* | 1.61 | |
| 8 | 130.28 | 5.96 | 132.38 | 5.76 | 133.72 | 6.54 | 44.59 | 6.53* | 13.35* | 4.47* | |
| 9 | 135.27 | 7.7 | 136.00 | 8.58 | 139.04 | 6.63 | 44.62 | 1.63 | 12.59* | 7.36* | |
*statistically significant differences at p≤0.05
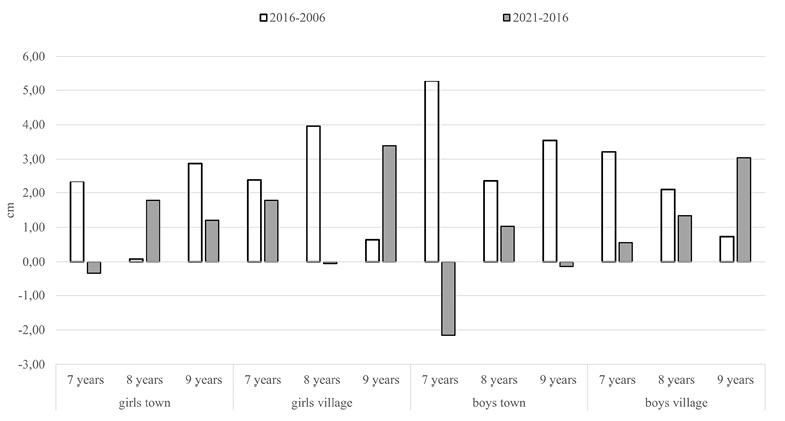
Fig. 1. Differences in the body height of girls and boys in particular stages of the study, taking into account the size of the place of residence
During the period of 2006–2016, the BMI of urban girls aged 7–9 increased, on average, by 0.17 kg/m². During the same period, BMI of seven-year-olds decreased by -0.19 kg/m², while an increase of 0.49 kg/m² and 0.22 kg/m² was observed among nine-year-olds and eight-year-olds respectively (Table 3, Figure 2). Between the years 2006 and 2016, rural girls showed greater differences in BMI, on average by 0.23 kg/m². The highest values of the secular trend were found at the age of 8 (0.75 kg/m²), followed by a seven-year-old (0.17 kg/m²). Nine-year-olds recorded a decrease in the value of this height-weight index by 0.24 kg/m².
It should be emphasized that in 2016–2021, much more significant changes in BMI were observed than in the previous decade. In girls living in towns, BMI increased by an average of 1.14 kg/m², and 0.68 kg/m² in their peers from the countryside. In the first group, the most significant differences were observed among seven-year-olds (1.65 kg/m²), followed by eight-year-olds (0.99 kg/m²), and the smallest in nine-year-olds (0.79 kg/m²). In the respondents from the countryside, the greatest changes were noted in nine-year-olds (0.74 kg/m²) and eight-year-olds (0.72 kg/m²). The lowest changes in BMI values were observed among seven-year-olds (0.58 kg/m²).
From 2006 to 2016, a greater increase in BMI was observed among boys from towns compared to their peers living in countryside, with the average differences of 0.76 kg/m² and 0.47 kg/m² respectively. In boys from towns, the greatest differences in BMI values were found in nine-year-olds (0.84 kg/m²), while the greatest BMI differences in boys living in rural areas were found among eight-year-olds (0.62 kg/m²). On the other hand, the smallest differences in rural residents were recorded at the age of 9 (0.36 kg/m²) and at the age of 8 in urban respondents (0.65 kg/m²).
Between the years 2016 and 2021, greater changes in BMI values were recorded in students of rural schools compared to their peers from towns. The average differences, when considering all age groups, were as follows: 1.02 kg/m² and 0.56 kg/m². Among urban residents, the greatest changes were found in seven-year-olds (0.99 kg/m²), and the smallest in nine-year-olds (0.19 kg/m²). On the other hand, in the respondents from the countryside, the difference in nine-year-olds was 1.14 kg/m², and in eight-year-olds it was 0.89 kg/m². All described above changes were statistically significant at the level of p< 0.05.
The picture of secular trends in body mass index described above is somewhat flattened and represents the results of all study participants. It is interesting, however, what changes occurred in girls regarding weight-height proportions and individual degrees of underweight, overweight, and obesity. Figure 3 and Table 4 show that the percentage of girls with I○ underweight decreased between 2006 and 2016 and this decrease was statistically significantly (p<0.05) (5.07%). In the remaining groups, the differences were small and statistically insignificant. In contrast, between the years 2016 and 2021, a significant (p< 0.05) reduction in the incidence of III○ underweight (by 3.67%) and overweight (by 4.41%) was observed among young women living in towns. On the other hand, there was a significant increase (by 11.00%) in the incidence of obesity.
| age (years) | year of study | Anova | Newmann-Keuls test | |||||||
| 2006 | 2016 | 2021 | 2006 | 2016 | 2021 | |||||
| x– | SD | x– | SD | x– | SD | |||||
| girls town | ||||||||||
| 7 | 15.33 | 2.20 | 15.14 | 2.59 | 16.79 | 3.01 | 18.46 | 4.38* | 4.46* | 8.15* |
| 8 | 15.96 | 2.21 | 16.18 | 2.53 | 17.17 | 3.16 | 16.81 | 0.10 | 7.28* | 5.26* |
| 9 | 2.50 | 17.24 | 2.25 | 18.03 | 3.44 | 7.72 | 0.21 | 4.70* | 3.80* | |
| girls village | ||||||||||
| 7 | 16.12 | 2.42 | 16.29 | 2.50 | 16.87 | 2.96 | 30.05 | 5.30* | 10.91* | 3.76* |
| 8 | 16.16 | 2.43 | 16.91 | 2.51 | 17.63 | 3.54 | 23.01 | 4.31* | 9.31* | 4.06* |
| 9 | 17.29 | 2.72 | 17.05 | 2.80 | 17.79 | 3.41 | 11.90 | 1.42 | 6.18* | 4.36* |
| boys town | ||||||||||
| 7 | 15.01 | 2.10 | 15.80 | 2.36 | 16.79 | 2.74 | 41.15 | 3.94* | 12.42* | 5.71* |
| 8 | 16.25 | 1.90 | 16.90 | 2.96 | 17.40 | 3.19 | 20.07 | 3.32* | 8.92* | 2.80* |
| 9 | 16.92 | 2.40 | 17.76 | 3.15 | 17.95 | 3.11 | 12.99 | 3.77* | 7.20* | 0.96 |
| boys village | ||||||||||
| 7 | 15.74 | 2.15 | 16.16 | 2.35 | 17.18 | 3.23 | 24.65 | 2.14 | 8.95* | 6.39* |
| 8 | 16.37 | 1.78 | 16.99 | 3.42 | 17.88 | 3.35 | 38.98 | 4.05* | 12.30* | 6.23* |
| 9 | 17.19 | 2.32 | 17.55 | 3.29 | 18.69 | 3.69 | 33.07 | 1.75 | 10.96* | 6,01* |
*statistically significant differences at p≤0.05
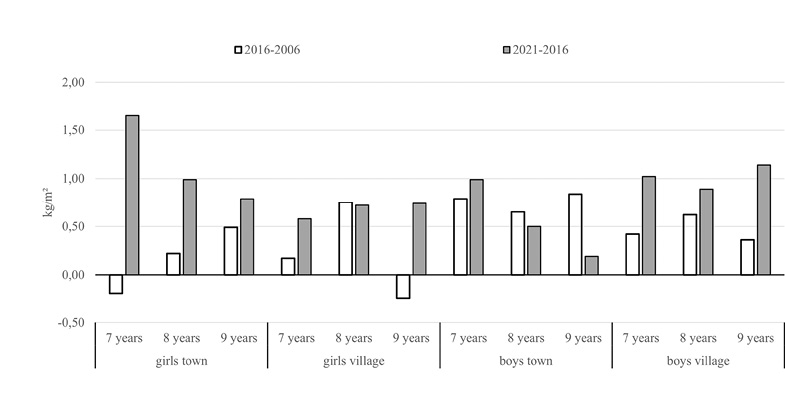
Fig. 2. Differences in the BMI of girls and boys at particular stages of the study, taking into account the size of the place of residence
Between the years 2006 and 2016, a significant (p<0.05) decrease in the prevalence of overweight (-3.98%) as well as an increase in obesity (by 6.12%) and II degree underweight (1.64%) were found among rural girls. Between the years 2016 and 2021, a significant (p<0.05) increase in the incidence of overweight (by 4.63%) and obesity (by 7.50%) was observed, as well as a decrease of II○ underweight (2.14%) and normal BMI (7.97%).
Using the χ2 test, environmental differences between all groups in particular study dates showed significant (p< 0.05) differences in the occurrence of III degree underweight (1.69% and 2.18%) in 2006 and 2016, in overweight (3, 81%) in 2006 and in obesity (3.50%) in 2016. Other differences were statistically insignificant (Table 4).
| year of study | χ2 test values | |||||
| 2006 | 2016 | 2021 | 2006 – 2016 |
2006 – 2021 |
2016 – 2021 |
|
| percentage of urban girls surveyed | ||||||
| III° underweight | 3.34 | 4.60 | 0.93 | 1.317 | 26.963* | 21.948* |
| II° underweight | 3.15 | 2.91 | 2.18 | 0.065 | 3.233 | 0.722 |
| I° underweight | 10.88 | 5.81 | 7.94 | 8.952* | 7.882* | 2.068 |
| normal weight | 61.16 | 63.20 | 58.87 | 0.136 | 0.507 | 0.668 |
| overweight | 18.06 | 18.89 | 14.48 | 0.104 | 6.286* | 3.584* |
| obesity | 3.40 | 4.60 | 15.60 | 1.178 | 139.327* | 35.321* |
| percentage of village girls surveyed | ||||||
| III° underweight | 1.65 | 1.42 | 0.78 | 2.062 | 3.184 | 2.062 |
| II° underweight | 2.48 | 4.12 | 1.98 | 8.411* | 0.520 | 8.411* |
| I° underweight | 10.91 | 9.66 | 8.26 | 1.082 | 3.264 | 1.082 |
| normal weight | 68.76 | 66.48 | 58.51 | 3.372 | 4.879* | 3.372 |
| overweight | 14.21 | 10.23 | 14.86 | 7.857* | 0.117 | 7.857* |
| obesity | 1.98 | 8.10 | 15.60 | 21.721* | 90.472* | 21.721* |
| χ2 test values for environmental differences | ||||||
| III° underweight | 4.748* | 7.900* | 0.260 | |||
| II° underweight | 0.681 | 0.063 | 0.199 | |||
| I° underweight | 0.000 | 0.864 | 0.128 | |||
| normal weight | 2.404 | 0.219 | 0.014 | |||
| overweight | 3.410* | 0.289 | 0.090 | |||
| obesity | 3.114 | 10.958* | 0.009 | |||
*statistically significant differences at p≤0.05
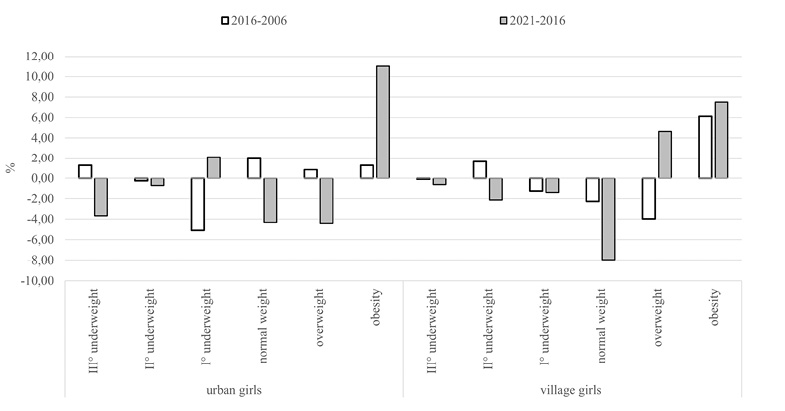
Fig. 3. Differences in the percentage of BMI in girls at particular stages of the study, taking into account the size of the place of residence
From 2006 to 2016, significant changes in weight-to-height proportions were also observed in boys (Figure 4, Table 5). Among urban residents, a significant (p<0.05) increase in the frequency of III○ underweight by 2.60% and overweight by 6.33% was observed. In the remaining BMI groups, the differences were small and statistically insignificant. A similar direction of changes in young residents of towns in eastern Poland was observed between the years 2016 and 2021. A decrease of 3.95% and 1.52% was found among the respondents exhibiting III○ and II○ underweight respectively, and an increase in the prevalence of obesity by 6.41%. Such differences were also observed among boys from rural areas. Between the years 2006 and 2016, a significant (p< 0.05) decrease in the percentage of underweight III○ (by 1.81%) and an increase in the percentage of underweight I○ (by 2.74%) among boys was found with obesity by 5.45%. Between the years 2016 and 2021, significant differences (p<0.05) were observed among boys from rural areas in all age groups. There was a decrease in the incidence of underweight III○ (by 0.84%), II○ (by 2.88%), I○ (by 3.76%), and normal BMI (by 9.17%). The opposite changes were observed in overweight (9.67% and obesity (6.97%).
When evaluating environmental differences between urban and rural boys in 2006, a significant (p<0.05) higher frequency of underweight III○ (by 1.23%) and lower underweight II○ (by 1.34%) was observed in rural boys. In 2016, compared to their peers from towns, boys from rural areas had a higher percentage of underweight I○ subjects (by 3.85%) and obesity (by 3.50%). Inverse relationships were observed in the incidence of underweight III○ (by 3.18%) and overweight (by 8.66%). In 2021, a higher percentage of overweight (by 3.00%) and obesity (by 4.06%) was found, while the frequency of normal BMI was lower (by 6.16%).
| year of study | χ2 test values | |||||
| 2006 | 2016 | 2021 | 2006–2016 | 2006–2021 | 2016–2021 | |
| percentage of urban boys surveyed | ||||||
| III° underweight | 2.00 | 4.60 | 0.65 | 7.527* | 14.749* | 29.383* |
| II° underweight | 2.72 | 2.91 | 1.39 | 0.039 | 8.907* | 4.140* |
| I° underweight | 8.00 | 5.81 | 6.59 | 2.124 | 2.615 | 0.315 |
| normal weight | 70.93 | 63.20 | 63.47 | 1.764 | 5.019* | 0.003 |
| overweight | 12.56 | 18.89 | 16.90 | 7.821* | 11.213* | 0.667 |
| obesity | 3.78 | 4.60 | 11.01 | 0.530 | 68.128* | 16.026* |
| percentage of village boys surveyed | ||||||
| III° underweight | 3.23 | 1.42 | 0.58 | 5.416* | 28.565* | 4.255* |
| II° underweight | 1.38 | 4.12 | 1.24 | 10.967* | 0.097 | 19.072* |
| I° underweight | 9.46 | 9.66 | 5.90 | 0.015 | 10.092* | 9.613* |
| normal weight | 71.97 | 66.48 | 57.31 | 1.000 | 12.992* | 4.585* |
| overweight | 11.30 | 10.23 | 19.90 | 0.377 | 24.914* | 27.821* |
| obesity | 2.65 | 8.10 | 15.07 | 21.773* | 99.863* | 19.427* |
| χ2test values for environmental differences | ||||||
| III° underweight | 3.42* | 9.422* | 0.100 | |||
| II° underweight | 4.91* | 1.044 | 0.181 | |||
| I° underweight | 1.32 | 4.572* | 0.820 | |||
| normal weight | 0.05 | 0.261 | 4.472* | |||
| overweight | 0.69 | 12.273* | 4.736* | |||
| obesity | 2.20 | 4.660* | 12.863* | |||
*statistically significant differences at p≤0.05
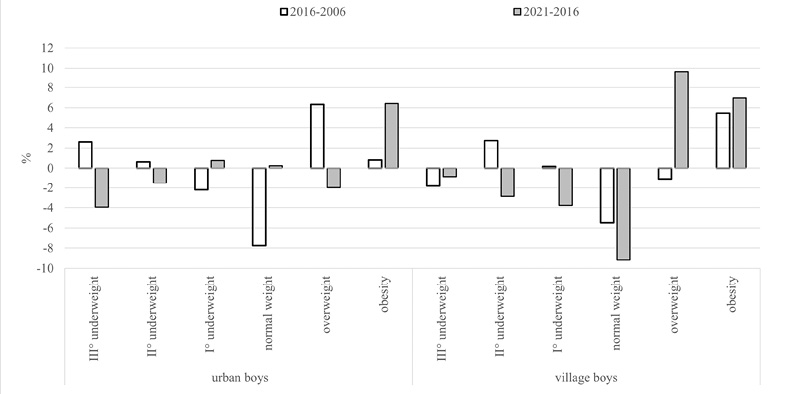
Fig. 4. Differences in the percentage of BMI in boys at particular stages of the study, taking into account the size of the place of residence
Discussion
The observed phenomenon of high growth of societies, resulting in an increase in body weight relative to its height, as well as the pace of intergenerational changes in BMI depends, to a large extent, on the socio-economic status and living conditions. Lower values of secular trends were observed among rural girls and boys who exhibited a lower standard of living. With the improvement of the latter, these differences tend to increase, which has been reported in studies conducted in countries with a rapid economic growth. In addition, in countries with a high degree of industrialization, a weakening trend in body height is observed coupled with an accelerated increase in body weight (Fudvoye and Parent 2017). Nevertheless, there are still significant differences in body height among young people living in economically developed countries in Europe and the USA (Gomula et.al 2021). Body weight, on the other hand, is less genetically determined and more influenced by the environment.
The socio-economic changes that have taken place after Poland’s accession to the European Union has had an impact on the magnitude of the secular trend in somatic development. Among girls and boys studied in selected regions of the country observed from 1966 to 2012, a positive secular trend was observed in both body height and BMI, with the exception of the relative body weight of girls aged 14–18 (Kozieł et al. 2014, Gomula et al. 2015). The authors observed greater changes in body height in the years 1966–1988 compared to the years 1988–2012. However, regarding BMI, the differences were greater in the years 1988–2012, i.e., in the period of political transformation and post-accession to the European Union. Dobosz (2012), in a study on a large nationwide sample, found a slowdown in the growth rate of the body height of children and adolescents in the years between 1999 and 2009 compared to the period of 1989–1999, as evidenced by the results of the oldest adolescents. On the other hand, in younger age groups, he noted the further acceleration of developmental processes exhibited by an acceleration of growth and maturation. In addition, a high rate of change in body weight observed in previous decades was maintained, especially among the youngest, among whom the greatest increase in the BMI values was observed (Dobosz 2012).
The secular trend in somatic features varied depending on region. For instance, in children and adolescents from Krakow in the years between 2000 and 2010, the average body height increased slightly (by approx. 1.00 cm), with a greater increase in body weight and BMI (Kowal 2011). Greater differences in growth were observed in primary and lower secondary school students from Lower Silesia during the 2001–2002 and 2010–2011 periods. The girls’ average body height increased from 1.75 cm to 2.45 cm. A significant increase in average body weight and BMI was also found (Ignasiak et al. 2016). In addition, in the years between 1986 and 2006, schoolgirls from eastern Poland exhibited an increase in body height and weight, resulting in higher BMI values. The greatest changes were observed in the period of 1996–2006 especially among girls in the prepubertal and pubertal periods, which indicates the acceleration of puberty (Saczuk 2018). Significant secular changes in the height and weight of rural schoolgirls from central-western Poland in the 1986–2016 period were reported by the Bartkowiak et al. (2021) study, which showed an average increase in the girls’ body height by 4.65 cm and body weight by 5.20 kg. In the line with the above study, we show that the trend of growing taller was still observed, with greater differences observed urban boys and girls from the countryside. However, in the next five years, higher values of secular trends of this somatic feature were found in girls from towns and boys from rural areas. Interestingly, in the years between 2016 and 2021, height changes among boys from towns were at a similar level. The magnitude of these changes might have been influenced by the environment of the place of residence. The lifestyle of young inhabitants of towns and villages differs significantly (Kaczmarek and Wolański 2018). Such changes may also be caused by the acceleration of puberty, as well as “catching up with developmental delays” in rural residents, which has been reported in previous years (Saczuk 2018). It has been previously shown that when the living conditions improve (when the stress stops), the slowdown in the growth rate occurring in childhood is quickly compensated (the catch-up growth phenomenon).
In the first of the analysed decades, greater changes in body mass index were observed in girls from rural areas and boys from towns. However, in the years between 2016 and 2021, higher BMI values were recorded in boys from rural areas as well as girls from towns. Moreover, in the years between 2016 and 2021, the differences in BMI were greater compared to the previous decade.
The described changes in the level of BMI are worrying and may suggest that future generations of young people will exhibit excess body mass in the further stages of ontogenesis. This assumption is supported by the incidence of deficiency and excess body mass. In the entire analysed decade as well as during the last five years, a decrease in the frequency of underweight and normal height-to-weight ratios was observed. However, a significant increase in the prevalence of obesity was found. Importantly, greater changes were observed in the rural environment. Nowadays there is a tendency towards reducing the number of children and adolescents with body weight deficiency and increase with its excess. This is supported by research by Ng et al. (2014) conducted in the years 1980–2013 in many countries around the world. This trend can be observed in developing countries and in economically highly developed countries. This trend, however, occurs with a greater intensity among urban than rural residents. The above finding is based on a study conducted on girls and boys in Brazil, China, Russia, USA (Wang et al. 2002), and Australia (Hardy et al. 2017). Eating and exercise habits may affect changes in increasing excess body weight (Wang et al. 2002; Hardy et al. 2017). Hardy et al. (2017) point out that the trend of increasing excess body weight in developed countries is slowing down. Therefore, the decrease in the incidence of underweight in all groups can be considered positive. It is an important clinical and public health problem among children and adolescents associated with adverse health outcomes at all stages of human life and may reflect food poverty (Ieiri et al. 2021), unhealthy eating habits (Rawal et al. 2021), or an increased risk of many diseases. Underweight children and adolescents are more likely to suffer from infectious diseases (Goutines et al. 2021), have reduced cognitive functions (Suryawan et al. 2021), mental disorders (Donkor et al. 2021; Zeiler et al. 2021) and have low scores your health (Linardon et al. 2021).
According to the Eurostat report (2018), the voivodeships of eastern Poland are among the poorest macro-regions of the European Union, where the income per capita does not exceed 50% of the average income in the EU. Despite the introduction of the 500+ government program in 2016, under which PLN 500 per child is donated monthly and suppose to help economically disadvantaged families, significant environmental differences in the level of nutrition are still observed among adolescents. Moreover, the changes observed in the last five years are particularly disturbing. The reduction in physical activity observed among children and adolescents since 2020 has been affected by restrictions related to the COVID-19 pandemic, during which distance learning was introduced and sports facilities were closed, all of which reduced their physical activity. The latter, in turn, might be responsible for the recent increase in the incidence of excess body weight among children who participated in this study.
Conclusions
- In the analyzed period, significant changes in body height and body mass index were found among schoolchildren.
- Among girls, a systematic increase in body height was observed between 2006 and 2021. However, in boys, such a tendency was found only in rural residents.
- In the 2006–2016 period, greater changes in BMI were found in girls from rural areas and boys from towns, while the opposite pattern was recorded in the 2016–2021 period.
- In the years between 2006 and 2021, the incidence of underweight and normal BMI decreased, while the incidence of overweight and obesity increased.
- The results of this study indicate the need for conducting systematic research in order to assess the nutritional status of young people living in the Lubelskie, Podlaskie, and Podkarpackie voivodeships, and to conduct an in-depth analysis regarding the causes of malnutrition and undertake educational activities.
Acknowledgements
The research was carried out with the financial support research of the Academy of Physical Education in Warsaw and as part of the “Active return to school – PE with AWF” program.
Conflict of interest
The authors declare that there is no conflict of interests regarding the publication of this study.
Authors’ contributions
AW and JS design the study, collected the data, oversaw the statistical analysis/interpretation, and were the authors of the written content. AB collected the data, and was the author of the written content

